Updated
TikTok saves and shares: what people save, share and comment on
TikTok tutorials drew 41 saves per 100 likes, about 10 times the rate for funny videos.
Sample: 1,278 TikTok posts

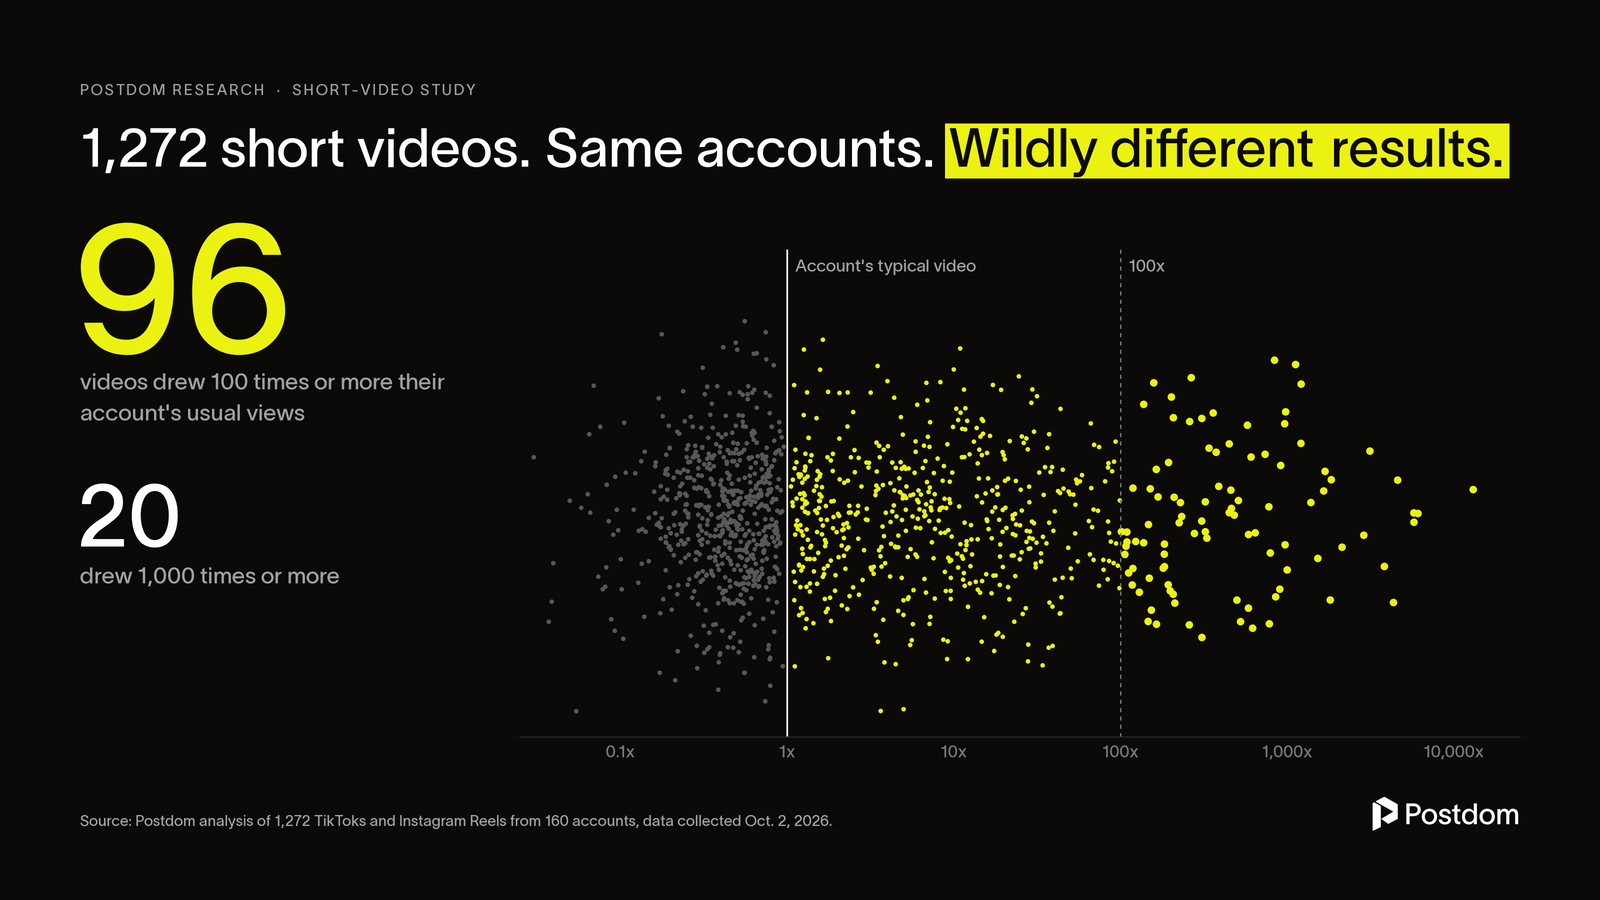
What makes a video go viral? Postdom compared 1,272 TikToks and Instagram Reels from 160 business, brand and creator accounts with each account's own typical video, and measured how 59 features of the hook, format, editing and ending moved views.
Sample: 1,272 videos from 160 accountsCharts to embedDownload the dataHow to cite
Every chart is free to use with a link back to this page. The embed code includes the link.
Aggregate figures only. The files name no accounts. Free to reuse with a link to this page.
All 1,272 videos pooled. "n" is videos with the feature in accounts that posted both with and without it (only those accounts contribute to the comparison). * = the 95% range excludes 1x.
| Feature | Views | 95% range | n (videos / accounts) | TikTok saves | TikTok shares |
|---|---|---|---|---|---|
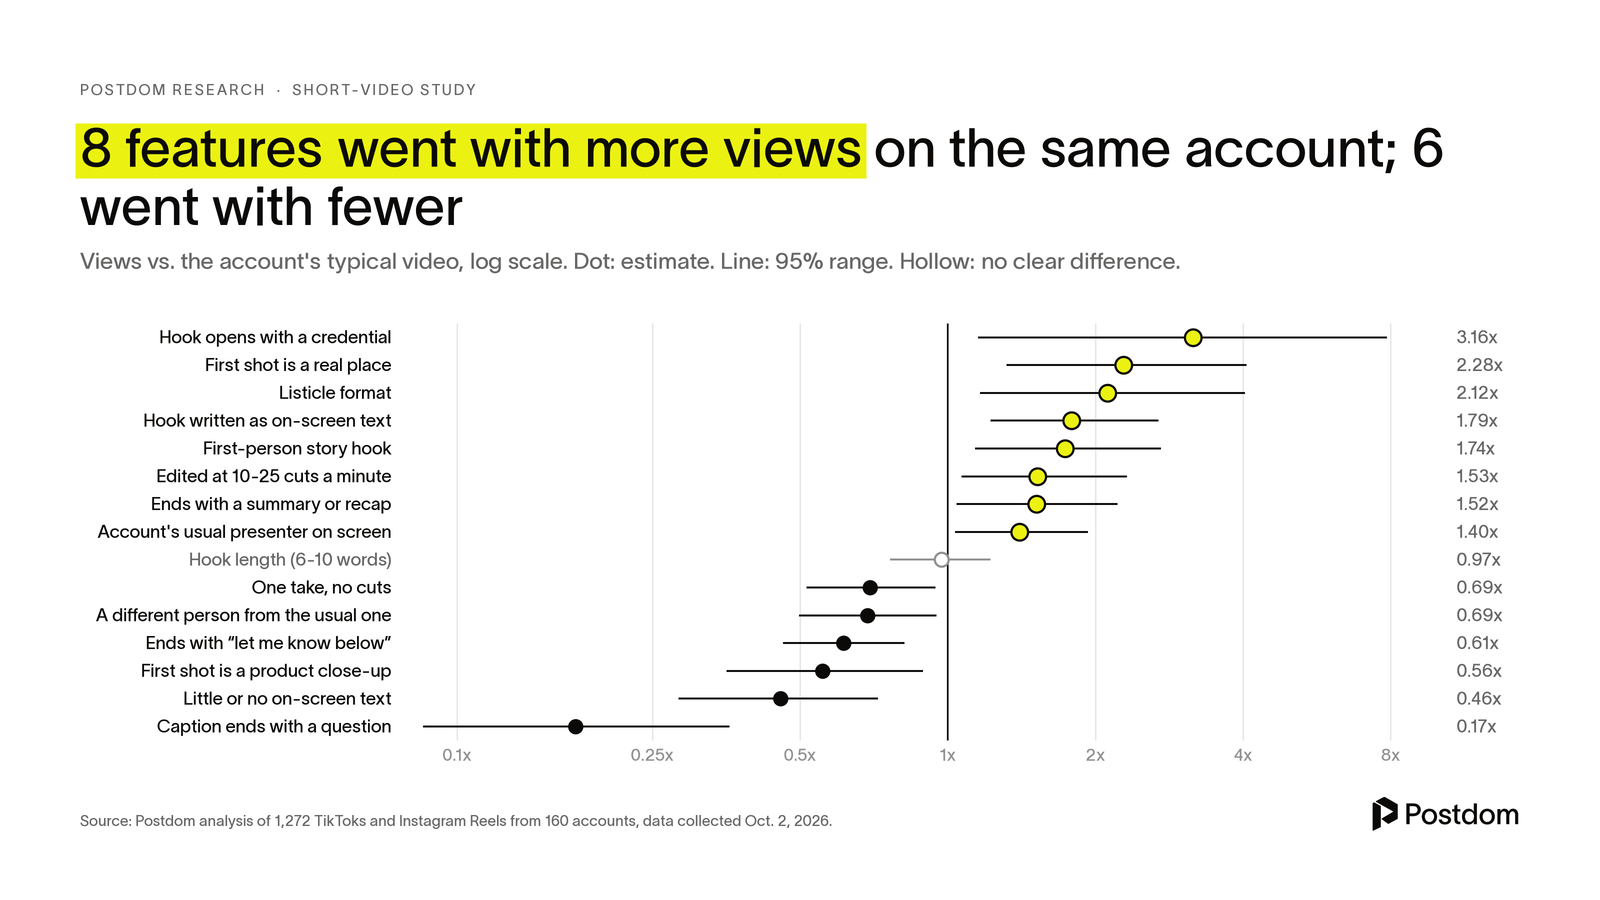
| Hook opens with a job or role ("as a dentist") | 3.16x* | 1.15-7.86 | 30 / 18 | 0.75x | 0.73x |
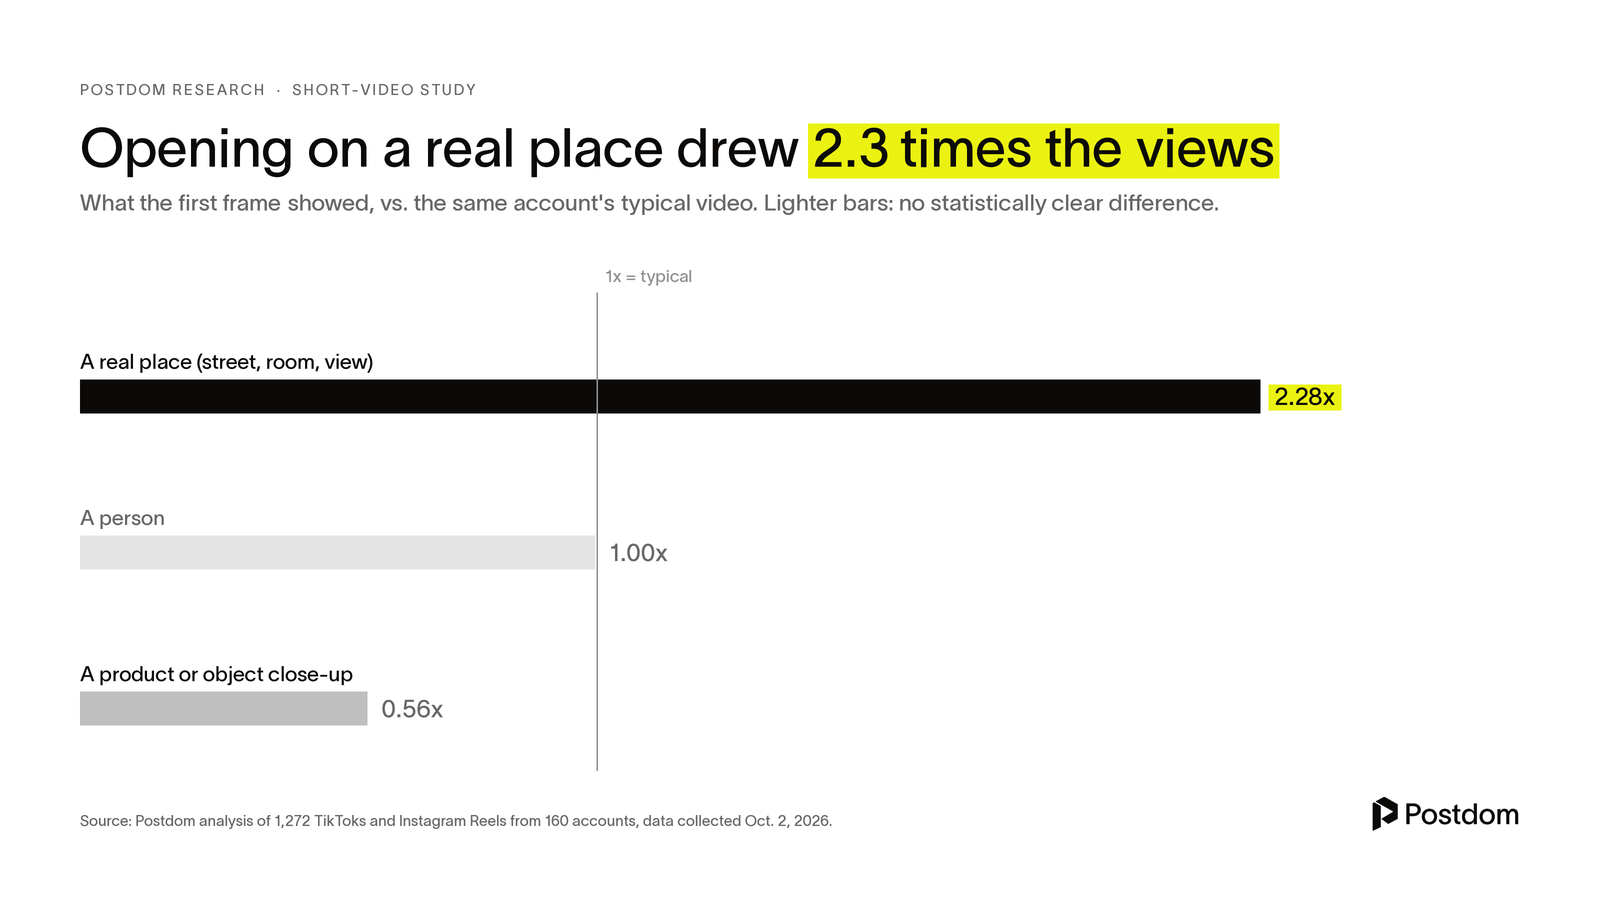
| First frame: a real place | 2.28x* | 1.32-4.07 | 112 / 64 | 1.07x | 1.10x |
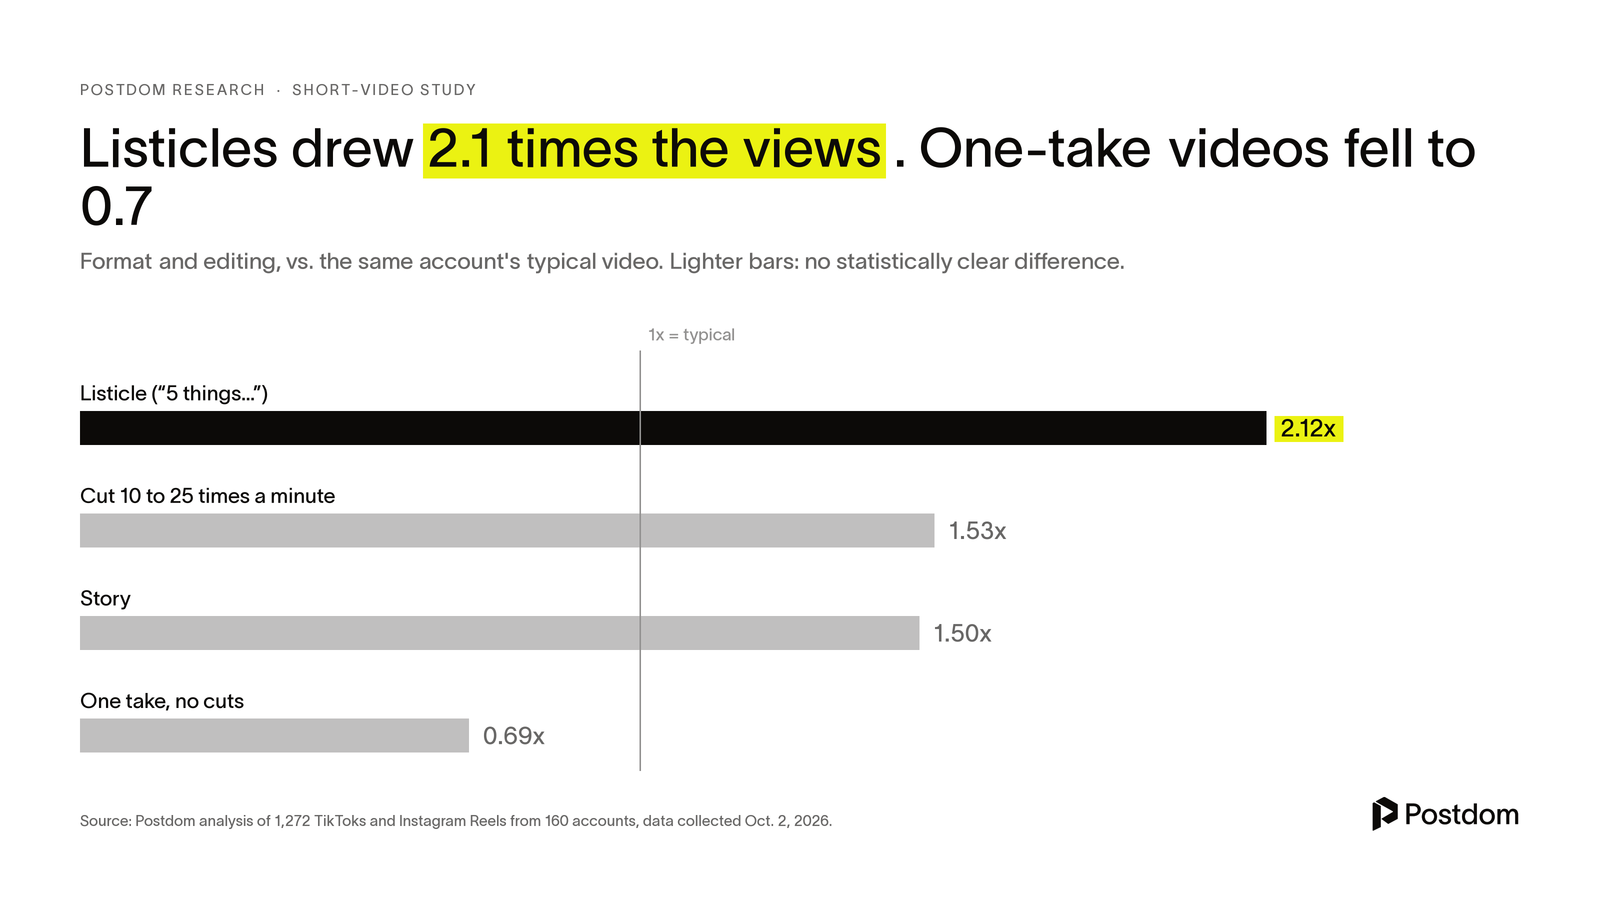
| Format: listicle | 2.12x* | 1.16-4.04 | 95 / 61 | 1.39x* | 0.92x |
| Ending: asks for a follow | 2.11x | 0.85-5.90 | 47 / 34 | 1.57x* | 1.39x* |
| Audio: voiceover | 1.95x* | 1.04-3.69 | 60 / 40 | 1.02x | 1.09x |
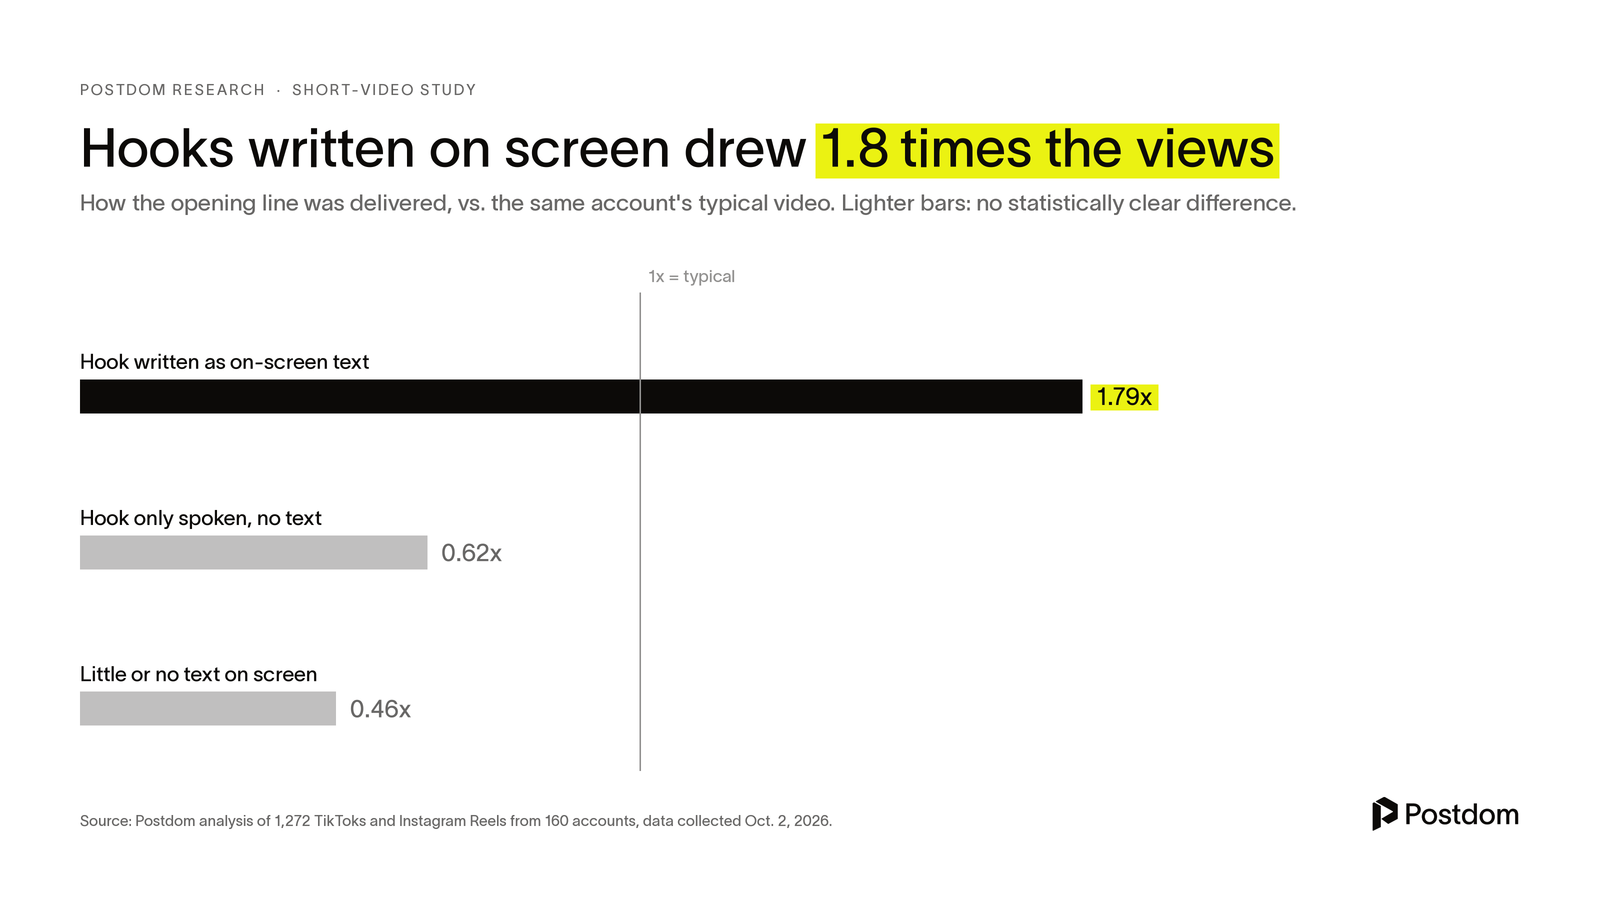
| On-screen text hook | 1.79x* | 1.22-2.69 | 500 / 82 | 1.19x | 1.15x |
| Hook: first-person story | 1.74x* | 1.14-2.72 | 135 / 79 | 0.75x* | 0.80x* |
| 10-25 cuts per minute | 1.53x* | 1.07-2.32 | 234 / 98 | 0.91x | 0.85x |
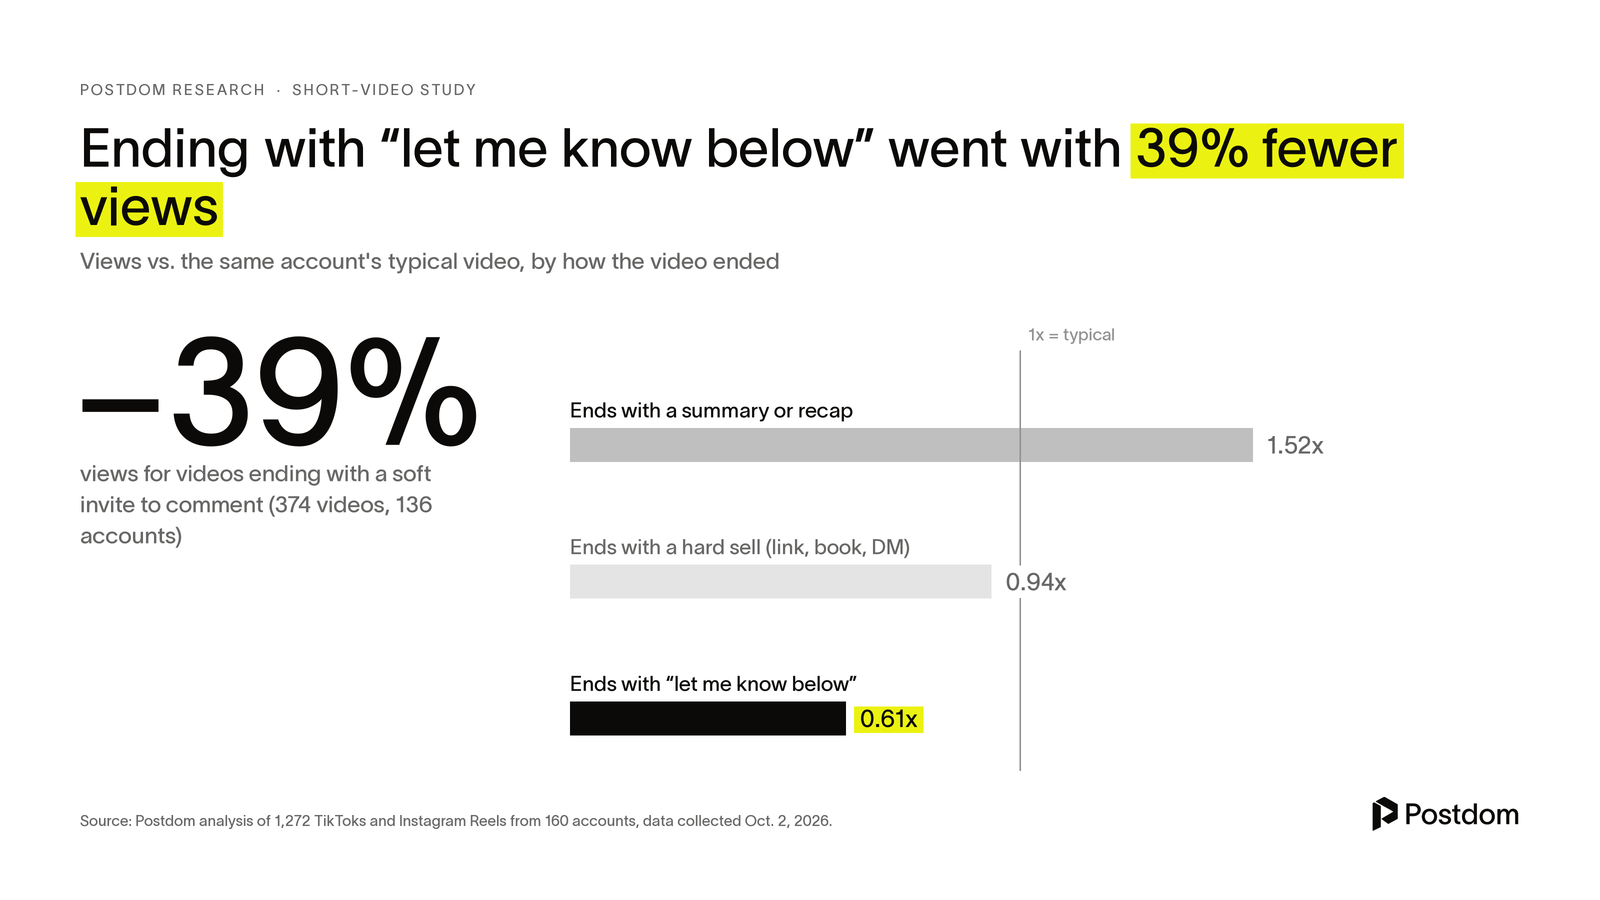
| Ending: summary / recap | 1.52x* | 1.04-2.22 | 250 / 104 | 1.21x* | 1.09x |
| Format: story | 1.50x* | 1.00-2.31 | 184 / 93 | 0.82x* | 0.92x |
| Open loop in the hook | 1.46x* | 1.13-1.89 | 686 / 142 | 1.01x | 0.91x |
| Account's usual presenter on screen | 1.40x* | 1.04-1.93 | 571 / 113 | 1.02x | 0.89x |
| Hook text medium size | 1.40x* | 1.06-1.84 | 581 / 134 | 1.06x | 1.01x |
| Format: tutorial / demo | 1.23x | 0.83-1.87 | 145 / 75 | 1.58x* | 1.13x |
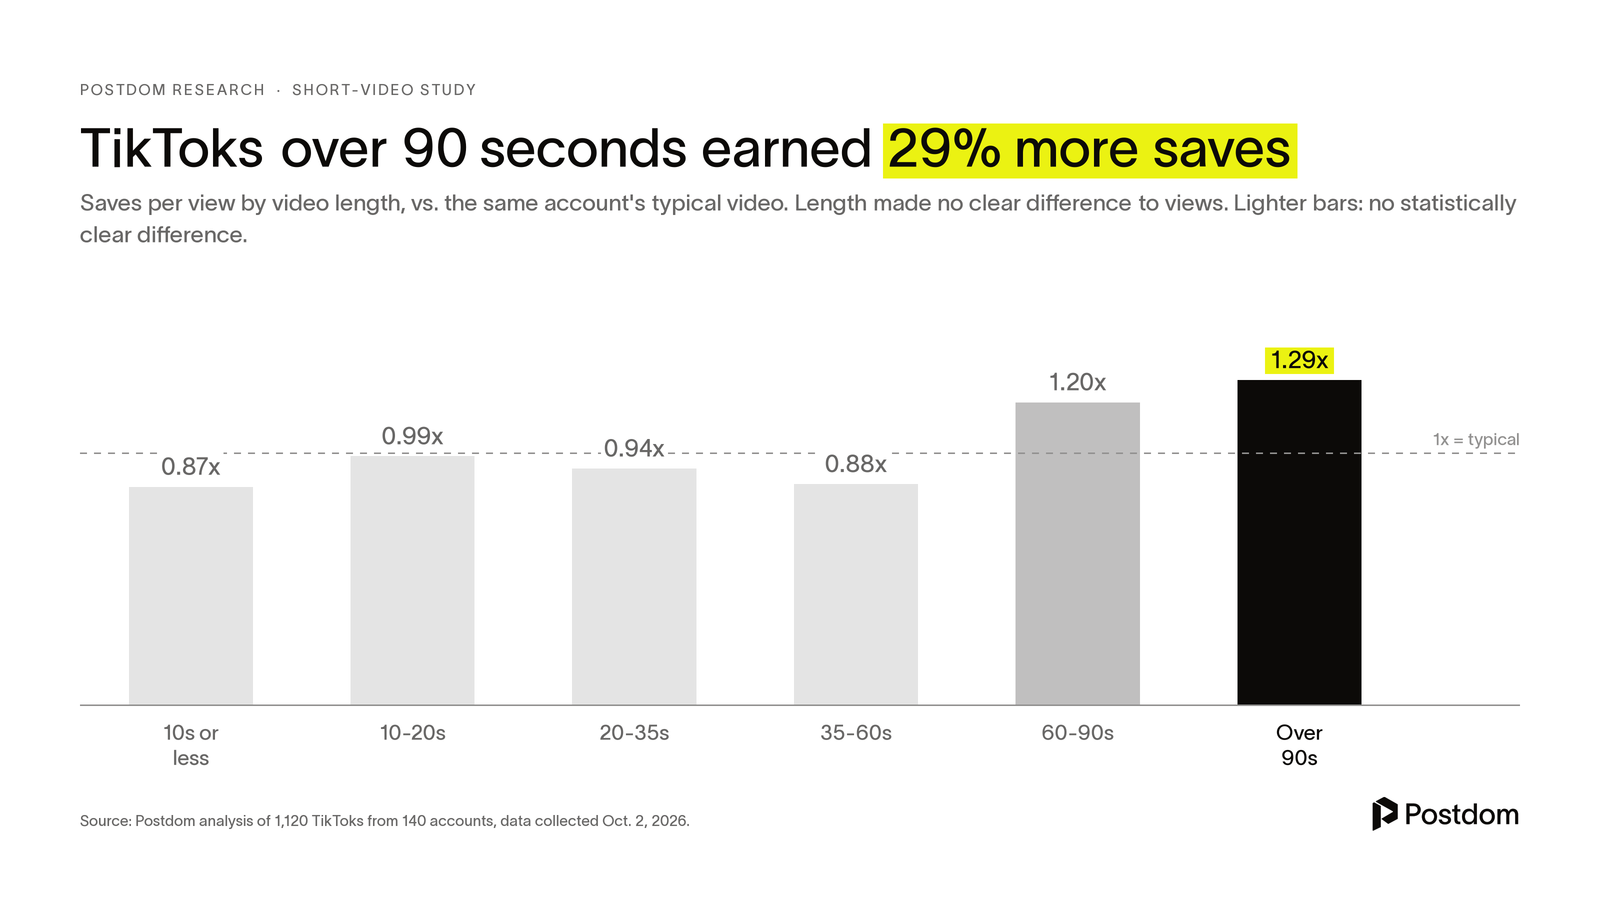
| Length over 90s | 1.22x | 0.87-1.76 | 196 / 88 | 1.29x* | 1.26x* |
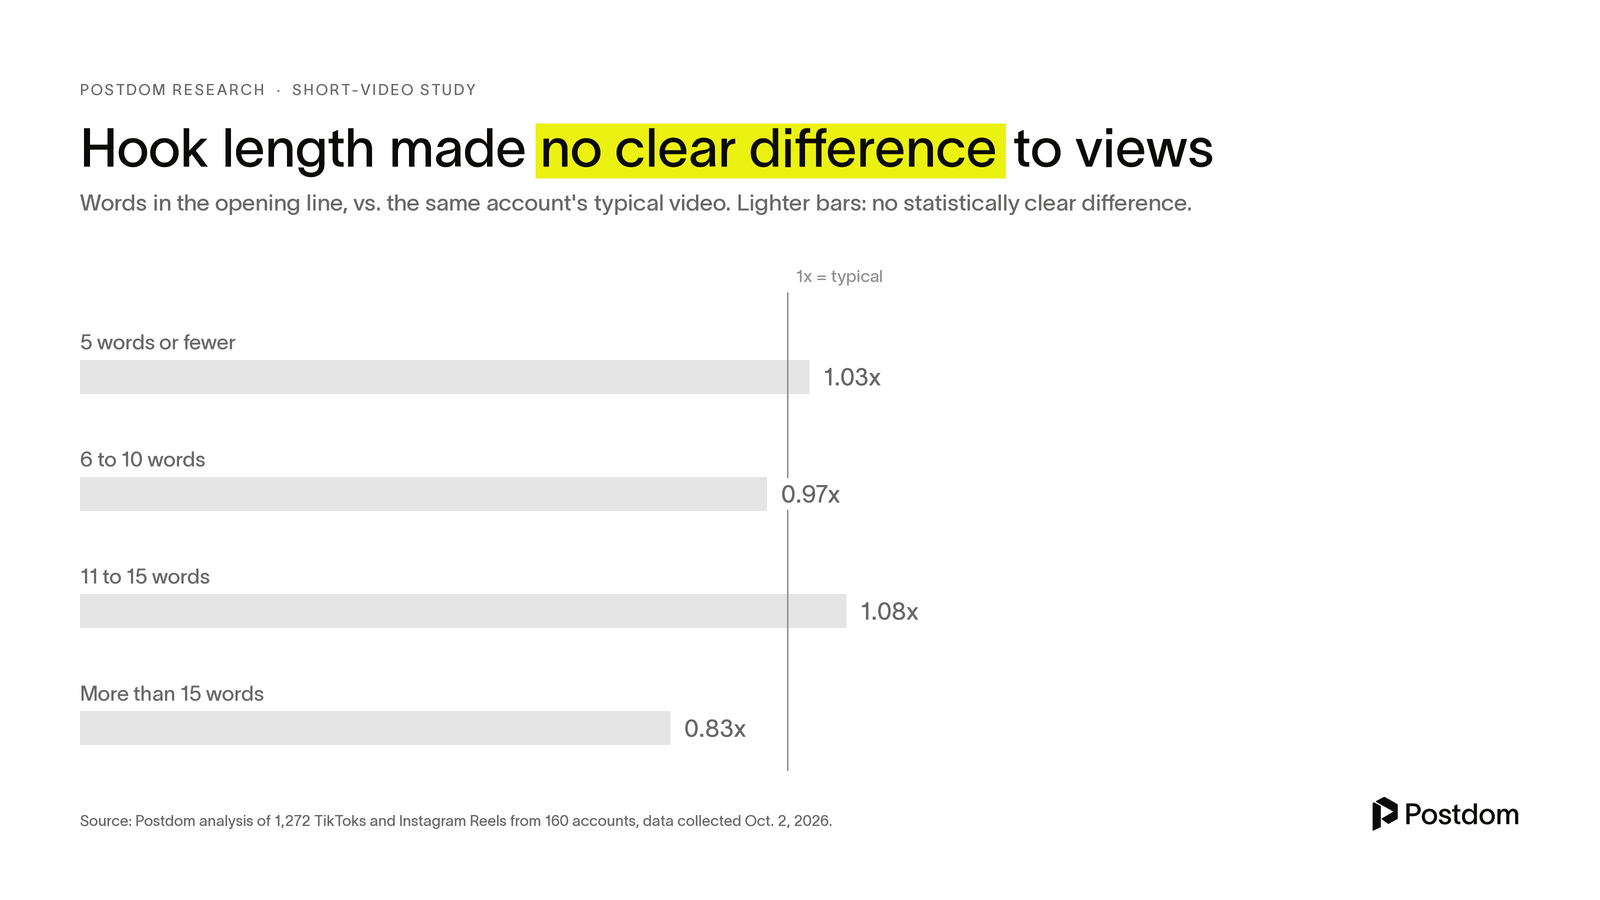
| Hook 11-15 words | 1.08x | 0.73-1.63 | 191 / 108 | 0.99x | 1.11x |
| Hook up to 5 words | 1.03x | 0.78-1.38 | 364 / 137 | 1.11x | 1.04x |
| First frame: any person | 1.00x | 0.67-1.43 | 540 / 99 | 0.99x | 0.92x |
| Hook 6-10 words | 0.97x | 0.76-1.22 | 591 / 153 | 0.98x | 0.94x |
| Ending: hard sell (link, buy, book, DM) | 0.94x | 0.67-1.37 | 258 / 111 | 0.94x | 0.91x |
| Caption over 300 characters | 0.93x | 0.62-1.40 | 274 / 83 | 1.16x* | 1.05x |
| Hook over 15 words | 0.83x | 0.54-1.31 | 116 / 79 | 0.86x | 0.85x |
| Hook all caps | 0.75x | 0.49-1.15 | 170 / 67 | 0.97x | 0.87x |
| One take, no cuts | 0.69x* | 0.52-0.94 | 388 / 122 | 0.92x | 1.05x |
| A different person from the usual one | 0.69x* | 0.50-0.95 | 187 / 88 | 0.87x | 1.03x |
| Format: product showcase | 0.67x | 0.45-1.04 | 197 / 84 | 0.88x | 1.02x |
| Format: day-in-the-life vlog | 0.67x | 0.41-1.11 | 114 / 50 | 0.86x | 0.92x |
| Spoken-only hook | 0.62x* | 0.41-0.91 | 145 / 79 | 0.88x | 0.87x |
| Ending: soft invite | 0.61x* | 0.46-0.82 | 374 / 136 | 0.96x | 0.96x |
| Caption under 60 characters | 0.60x* | 0.40-0.93 | 169 / 66 | 0.89x | 1.02x |
| First frame: product / object close-up | 0.56x* | 0.35-0.89 | 125 / 62 | 0.95x | 1.08x |
| Hook: day in the life | 0.56x* | 0.32-1.00 | 67 / 37 | 0.78x | 0.79x |
| Little or no on-screen text | 0.46x* | 0.28-0.72 | 111 / 56 | 0.72x* | 0.69x* |
| Hook text large (title card) | 0.38x* | 0.20-0.76 | 27 / 22 | 0.90x | 0.95x |
| Caption ends with a question | 0.17x* | 0.09-0.36 | 23 / 19 | 0.80x | 0.87x |
TikTok saves and shares are rates per view against the account's median rate. Instagram does not expose saves or shares publicly, so they are TikTok-only. The full 59-row table, with TikTok and Instagram split out, is in the CSV.
| Niche | Accounts | Videos | Typical best video vs median | Account median views (typical) | Strongest niche-specific signal |
|---|---|---|---|---|---|
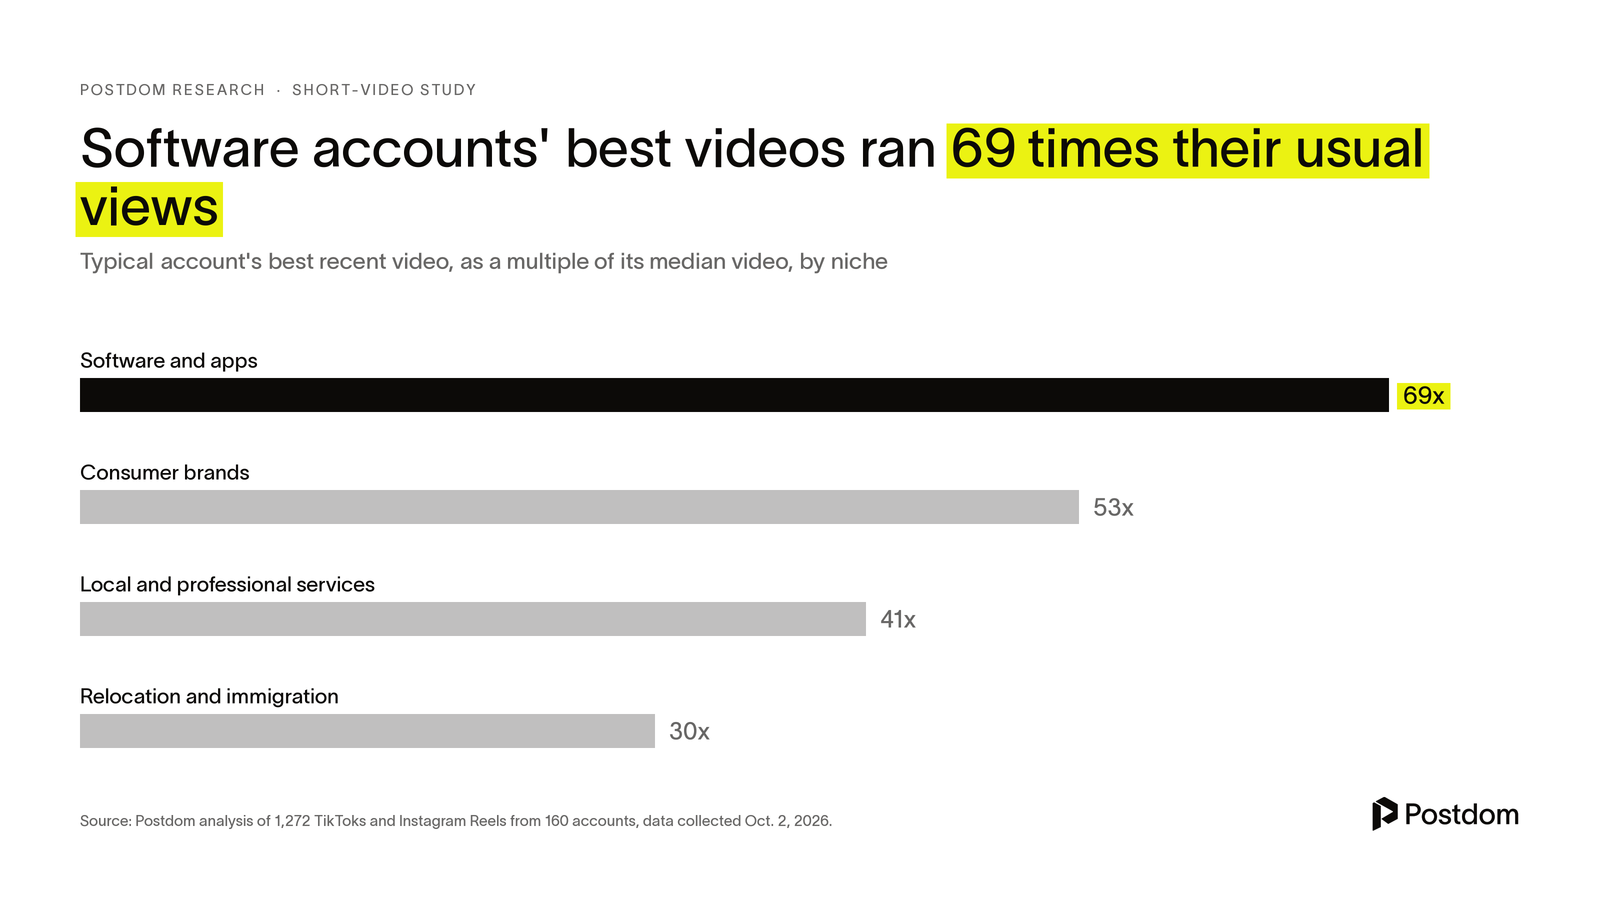
| Software and apps | 39 | 311 | 69x | 2,343 | Story hook 2.82x (1.06-7.22, n=37) |
| Consumer brands | 40 | 317 | 53x | 3,024 | Usual presenter 2.17x (1.47-3.53, n=123) |
| Local and professional services | 38 | 302 | 41x | 6,052 | Listicle 4.36x (1.55-13.67, n=31) |
| Relocation and immigration | 43 | 342 | 30x | 3,203 | Story hook 2.18x (0.97-4.99, n=35; not statistically clear) |
Accounts in all four niches had a similar number of eligible recent videos (median 31 to 33), so the differences in best-video size are not a posting-volume effect.
Collection. Public data was collected on Oct. 2, 2026 through a third-party scraping API (ScrapeCreators). TikTok accounts were found through 91 TikTok searches in four niches (relocation and immigration; local and professional services; software and apps; consumer brands), which returned 4,472 videos from 3,246 authors. A text pre-screen kept mostly brands and businesses, plus some niche creators. A vision check of four covers per account kept accounts that post their own footage with in-app text on at least three of four covers (632 of 1,162 screened). 140 TikTok accounts were then sampled by niche quota. Twenty Instagram brand and business accounts in the same niches were added by hand.
Who is in it. 1,120 TikToks from 140 accounts and 152 Reels from 20 accounts. By account type: 849 videos from business owners posting for their business, 136 from brand accounts, 287 from creators. Median TikTok account: about 28,000 followers, with a median video of about 3,000 views. 76% of the videos were posted in 2026; the oldest dates from January 2021. Median video length: 44 seconds.
Eligibility and sampling. A video was eligible if it was not an ad, was at least seven days old and was three minutes or shorter. Each account needed at least 10 eligible videos. For each account, every eligible video's views were divided by the median of all its eligible videos. From each account we analyzed the three best, the three worst and the videos at the one-third and two-thirds ranks: eight per account.
Labels. Labels were produced without access to view counts. Each video was sampled at eight frames (0.1 s, 1.5 s, 3 s, then evenly spaced), transcribed (OpenAI gpt-4o-mini-transcribe), and on-screen text and shot types were read from the frames (OpenAI gpt-4.1-mini). Hook type, format, ending and caption tags came from the text. Cuts per minute came from ffmpeg scene detection. A per-account vision pass marked whether each video shows the account's recurring presenter. Videos were downloaded transiently and deleted; only small frames were kept.
Statistics. For each feature, we compared the average log view-ratio of videos with and without it, using only accounts that had both, and report the result as a multiplier. 95% ranges come from 2,000 bootstrap resamples of accounts (fixed seed), so one prolific account cannot drive a result. "Share of top-3 / bottom-3" in the CSV is a second, design-robust view: how often a feature appears among accounts' three best versus three worst videos.
Limits.
Reproduce. The aggregate results for all 59 features can be downloaded as a CSV in the data section above, and every step of the method is described in this section.
Postdom. (2026, October 5). What makes a video go viral? Data from 1,272 TikToks and Reels. https://postdom.com/research/what-makes-a-video-go-viral
This page is updated in place as new data arrives, and the link stays the same. Cite the date of the version you used.