Snapshots after every post
Postdom checks each post at 1 hour, 6 hours, 1 day, 3 days, 7 days, 30 days and 90 days, on every plan.

Performance
Postdom's social media analytics show how every post did on each account, which posts led, and what changed week over week. Then Postdom uses what worked to shape the next videos, slideshows and single images it makes from your website, for you to approve.
Updated
Social media analytics is collecting the numbers your posts earn, such as views, watch time, shares and saves, and using them to decide what to post next. Postdom is an AI social media tool that turns your website into short videos, slideshows and posts, then publishes them. Its analytics follow every post it publishes on every account and shape the next posts it makes.
Short videos, slideshows and single images. Postdom made these for sample businesses (not real ones) from their websites. Yours are written from your own website, in your brand.






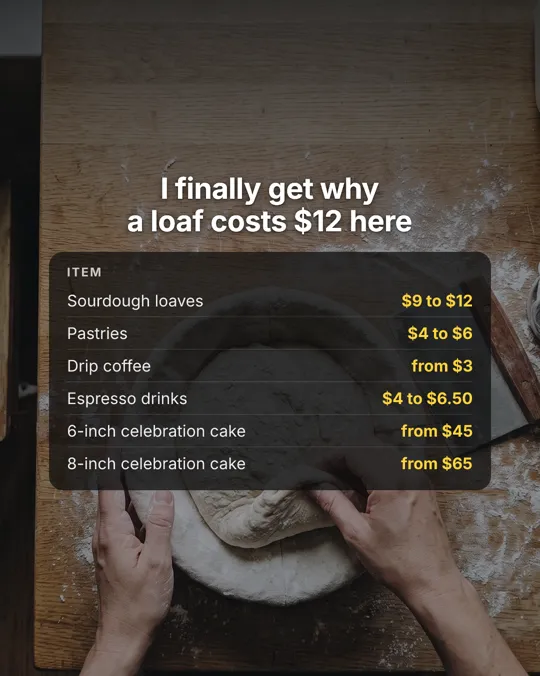






Real Postdom posts for sample brands, which aren't real businesses. Clips and photos are licensed stock or made with AI, as in the product.
Most analytics stop at a chart. Postdom keeps the numbers next to the posts that earned them, and puts them back to work.
Postdom checks each post at 1 hour, 6 hours, 1 day, 3 days, 7 days, 30 days and 90 days, on every plan.
See which posts led on each account, ranked by a metric the platform actually reported.
Every week, a short read of what changed week over week and what to try next.
Social media analytics is the practice of collecting the numbers your posts earn, such as views, watch time, likes, comments, shares, saves and follower change, and reading them to decide what to post next. Each platform reports a different set, so good analytics say which numbers exist for each post and which don't.
Postdom is an AI social media tool that turns your website into short videos, slideshows and posts, then publishes them. Its analytics use what worked to shape the next posts it makes.
| Metric | What it tells you |
|---|---|
| Views | How far a post traveled, including to people who don't follow you |
| Watch time and completion | Whether people stayed: the clearest sign a video held attention |
| Likes | A quick reaction; useful, but the weakest signal on its own |
| Comments | Whether the post started a conversation |
| Shares | Whether people passed it on, which brings new viewers |
| Saves | Whether people want to come back to it, common on lists and how-tos |
| Follower change | Whether viewers decided to see more from you |
To act on the numbers, see the best time to post on TikTok and how to get more views on TikTok.
Starter is $39 a month for 40 posts.
Performance snapshots, best posts and the weekly digest are included on every plan, and Growth and up keep a longer performance history.
Postdom's social media analytics dashboard puts every connected account in one place. Each post keeps its outcome on each platform, its timing and, when something failed, the reason.
For the exact metrics each platform reports, see the metric availability reference.
Tested contract fixture · not customer data
Used by the agent: this observation is eligible for comparison. No conclusion is generated for the agent.
Kept out of the ranking: The latest snapshot has no evidence-backed watch_time_s value.
Good social media performance is not one number. Views, watch time and completion move differently on each platform, and each platform reports a different set.
Postdom records each value with where it came from and when it was observed. When a platform does not report a metric, it shows as unavailable with the reason, never as a zero, so a quiet week never looks worse than it was.
Social media analytics reporting is the step that turns numbers into a decision: what to post more of, and what to stop. A useful report compares posts on the same account over the same window, uses only the metrics each platform reports, and leaves missing values out instead of counting them as zero.
Postdom posts to TikTok, Instagram Reels, YouTube Shorts, LinkedIn, Facebook Reels, X, Snapchat Stories, Threads and Bluesky, and its reports follow each post on each account: the snapshots, the best posts per account and the weekly digest.
Data from Postdom's research on 1,278 TikTok posts (updated 5 October 2026): tutorials drew 41 saves per 100 likes, about 10 times the rate for funny videos, and photo slideshows drew 51 saves per 100 likes. See TikTok saves and shares.
Social media analytics tools fall into two groups: schedulers that report on posts you make, and tools that make the posts and learn from the results. Postdom is the second kind.
| Tool | What its analytics are built for |
|---|---|
| Postdom | Posts it made from your website: each post's results on each account, then the next posts shaped by what worked |
| Buffer | Scheduling and reporting on posts you make yourself |
| Hootsuite | Scheduling, inbox, listening and reports for posts you make yourself |
| Sprout Social | Scheduling, inbox, listening and in-depth reports for teams that make their own posts |
Pick a scheduler's reports if you already make every post. Pick Postdom if you want the posts made too, with the results feeding the next ones.
Prices and plans change, so this comparison covers what each tool is for, not its prices (checked 9 October 2026). For prices, see Postdom pricing.
Social media analytics software reads each platform's numbers so you don't open every app. Postdom reads performance after each post at 1 hour, 6 hours, 1 day, 3 days, 7 days, 30 days and 90 days, ranks each account's best posts by a metric the platform reported, and sends a weekly digest. Its analytics cover the posts you publish through Postdom on the accounts you connect.
Every approve, edit and skip, and every post's results, feed the next posts in your For You feed.
You still decide. Postdom offers ideas based on what worked; nothing posts until you approve it.
Postdom reads performance where each platform reports it. A metric a platform does not report shows as unavailable, with the reason, instead of a zero.
Yes. What worked, and every approve, edit and skip, shapes the next posts Postdom makes from your website.
Yes. The MCP server, the REST API, the SDKs and webhooks are included on every plan. Your own agent uses its own model. Tools such as get_performance and get_best_posts return the same evidence the dashboard shows.
It means collecting the numbers your posts earn, such as views, watch time, comments, shares and saves, and using them to decide what to post next.
Yes. ChatGPT can analyze numbers you give it, and in Developer mode on Plus, Pro, Business, Enterprise and Education (web) it can connect to Postdom's MCP server and read your posts' performance with get_performance and get_best_posts.
Weekly is enough for most small businesses. Postdom checks each post for you and sends a weekly digest, so you read one summary instead of every chart.
Paste your website. Postdom makes the posts, you approve them, and the analytics show what to make next.
Social media reporting
Social media reporting is sharing what happened in a period with the people who decide what comes next. Postdom's weekly digest is that report: what changed week over week, which posts led on each account, which failed and why, and which numbers a platform did not report. Your AI agent can read the same digest with get_digest over Postdom's MCP server.