
Research
What makes a short video go viral: we studied 1,272 to find out

Postdom compared 1,272 TikToks and Reels with each account's typical post. Text on screen and a real place in the first frame went with breakouts. Hook length did not.

On this page
Postdom Research | What makes a short video go viral, October 2026
The most common way to end a short video, a soft invite like "let me know below," went with 39% fewer views than the same account's typical post. Postdom found that in an analysis of 1,272 TikToks and Instagram Reels. The same study found that hook length, a staple of posting advice, made no clear difference.
Key findings: what makes a short video go viral
- Videos that ended with a soft invite such as "let me know below" drew 39% fewer views. Videos that ended with a quick recap drew 52% more.
- Hooks written as text on screen drew 1.8 times the account's typical views. Hook length made no clear difference.
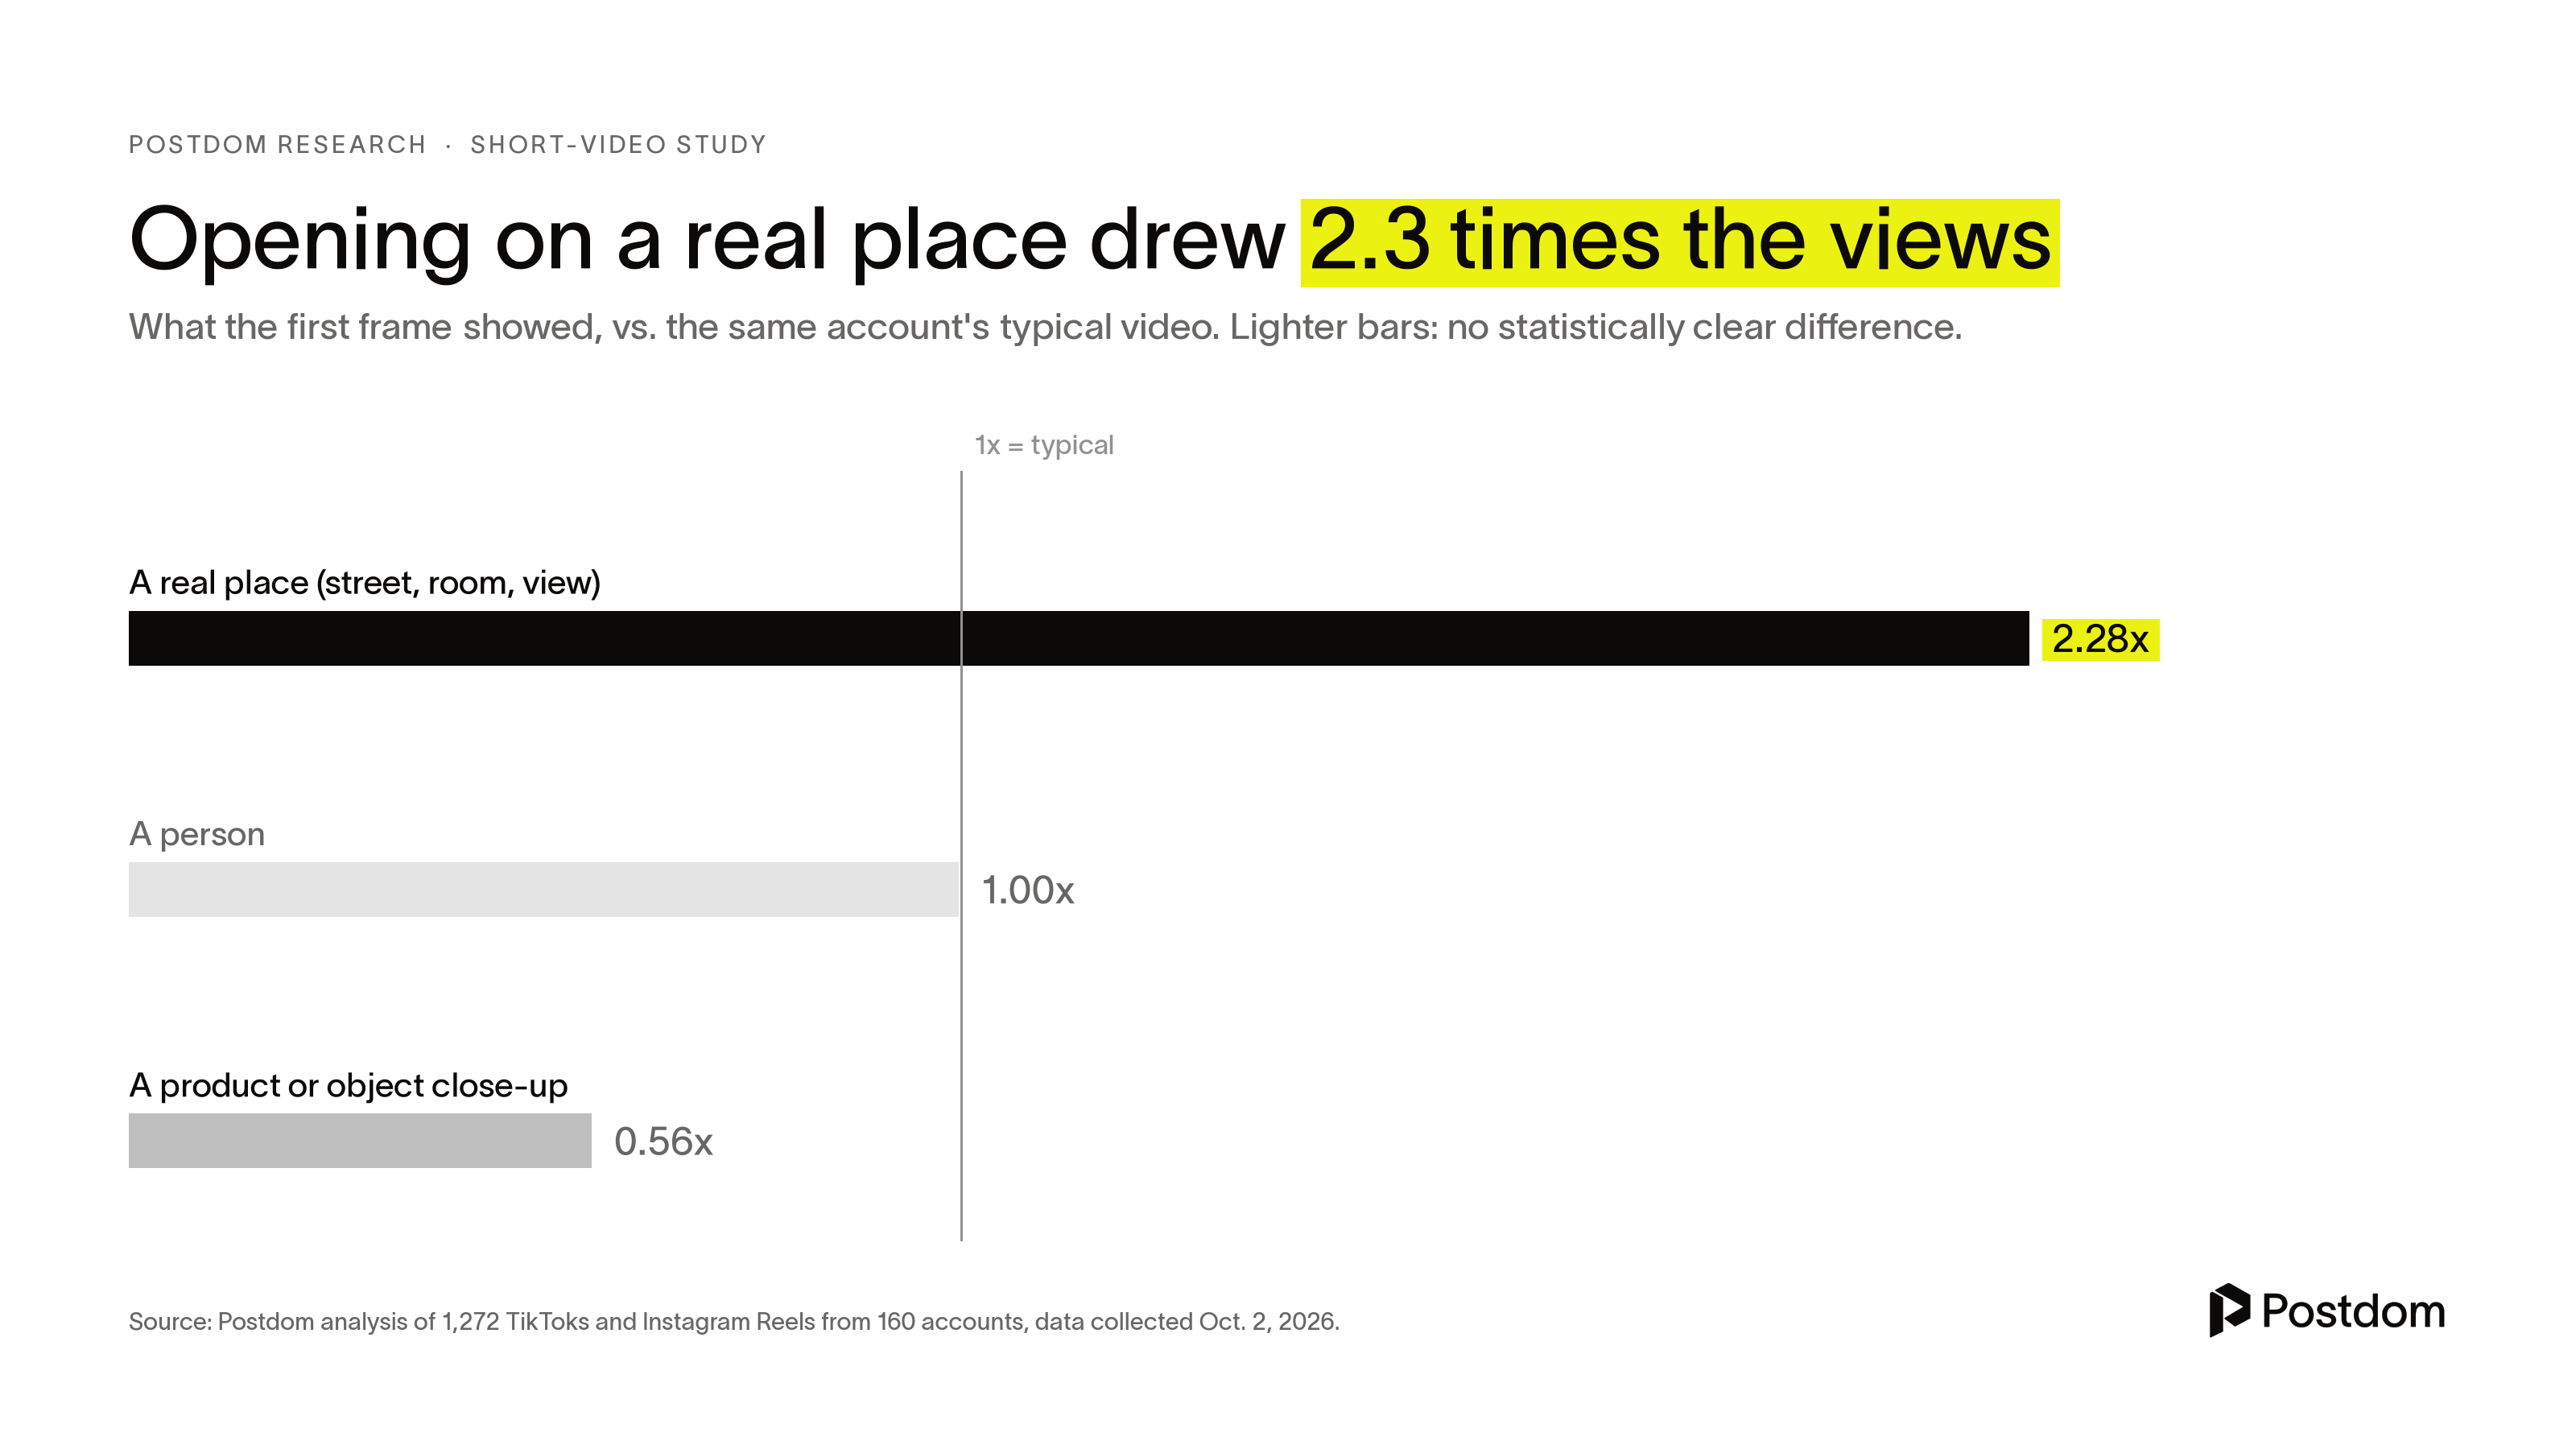
- Opening on a real place, such as a street or a room, drew 2.3 times the views. Opening on a product close-up drew about half.
- Breakouts are common: 84% of the 160 accounts had a video that reached 10 times their usual views.
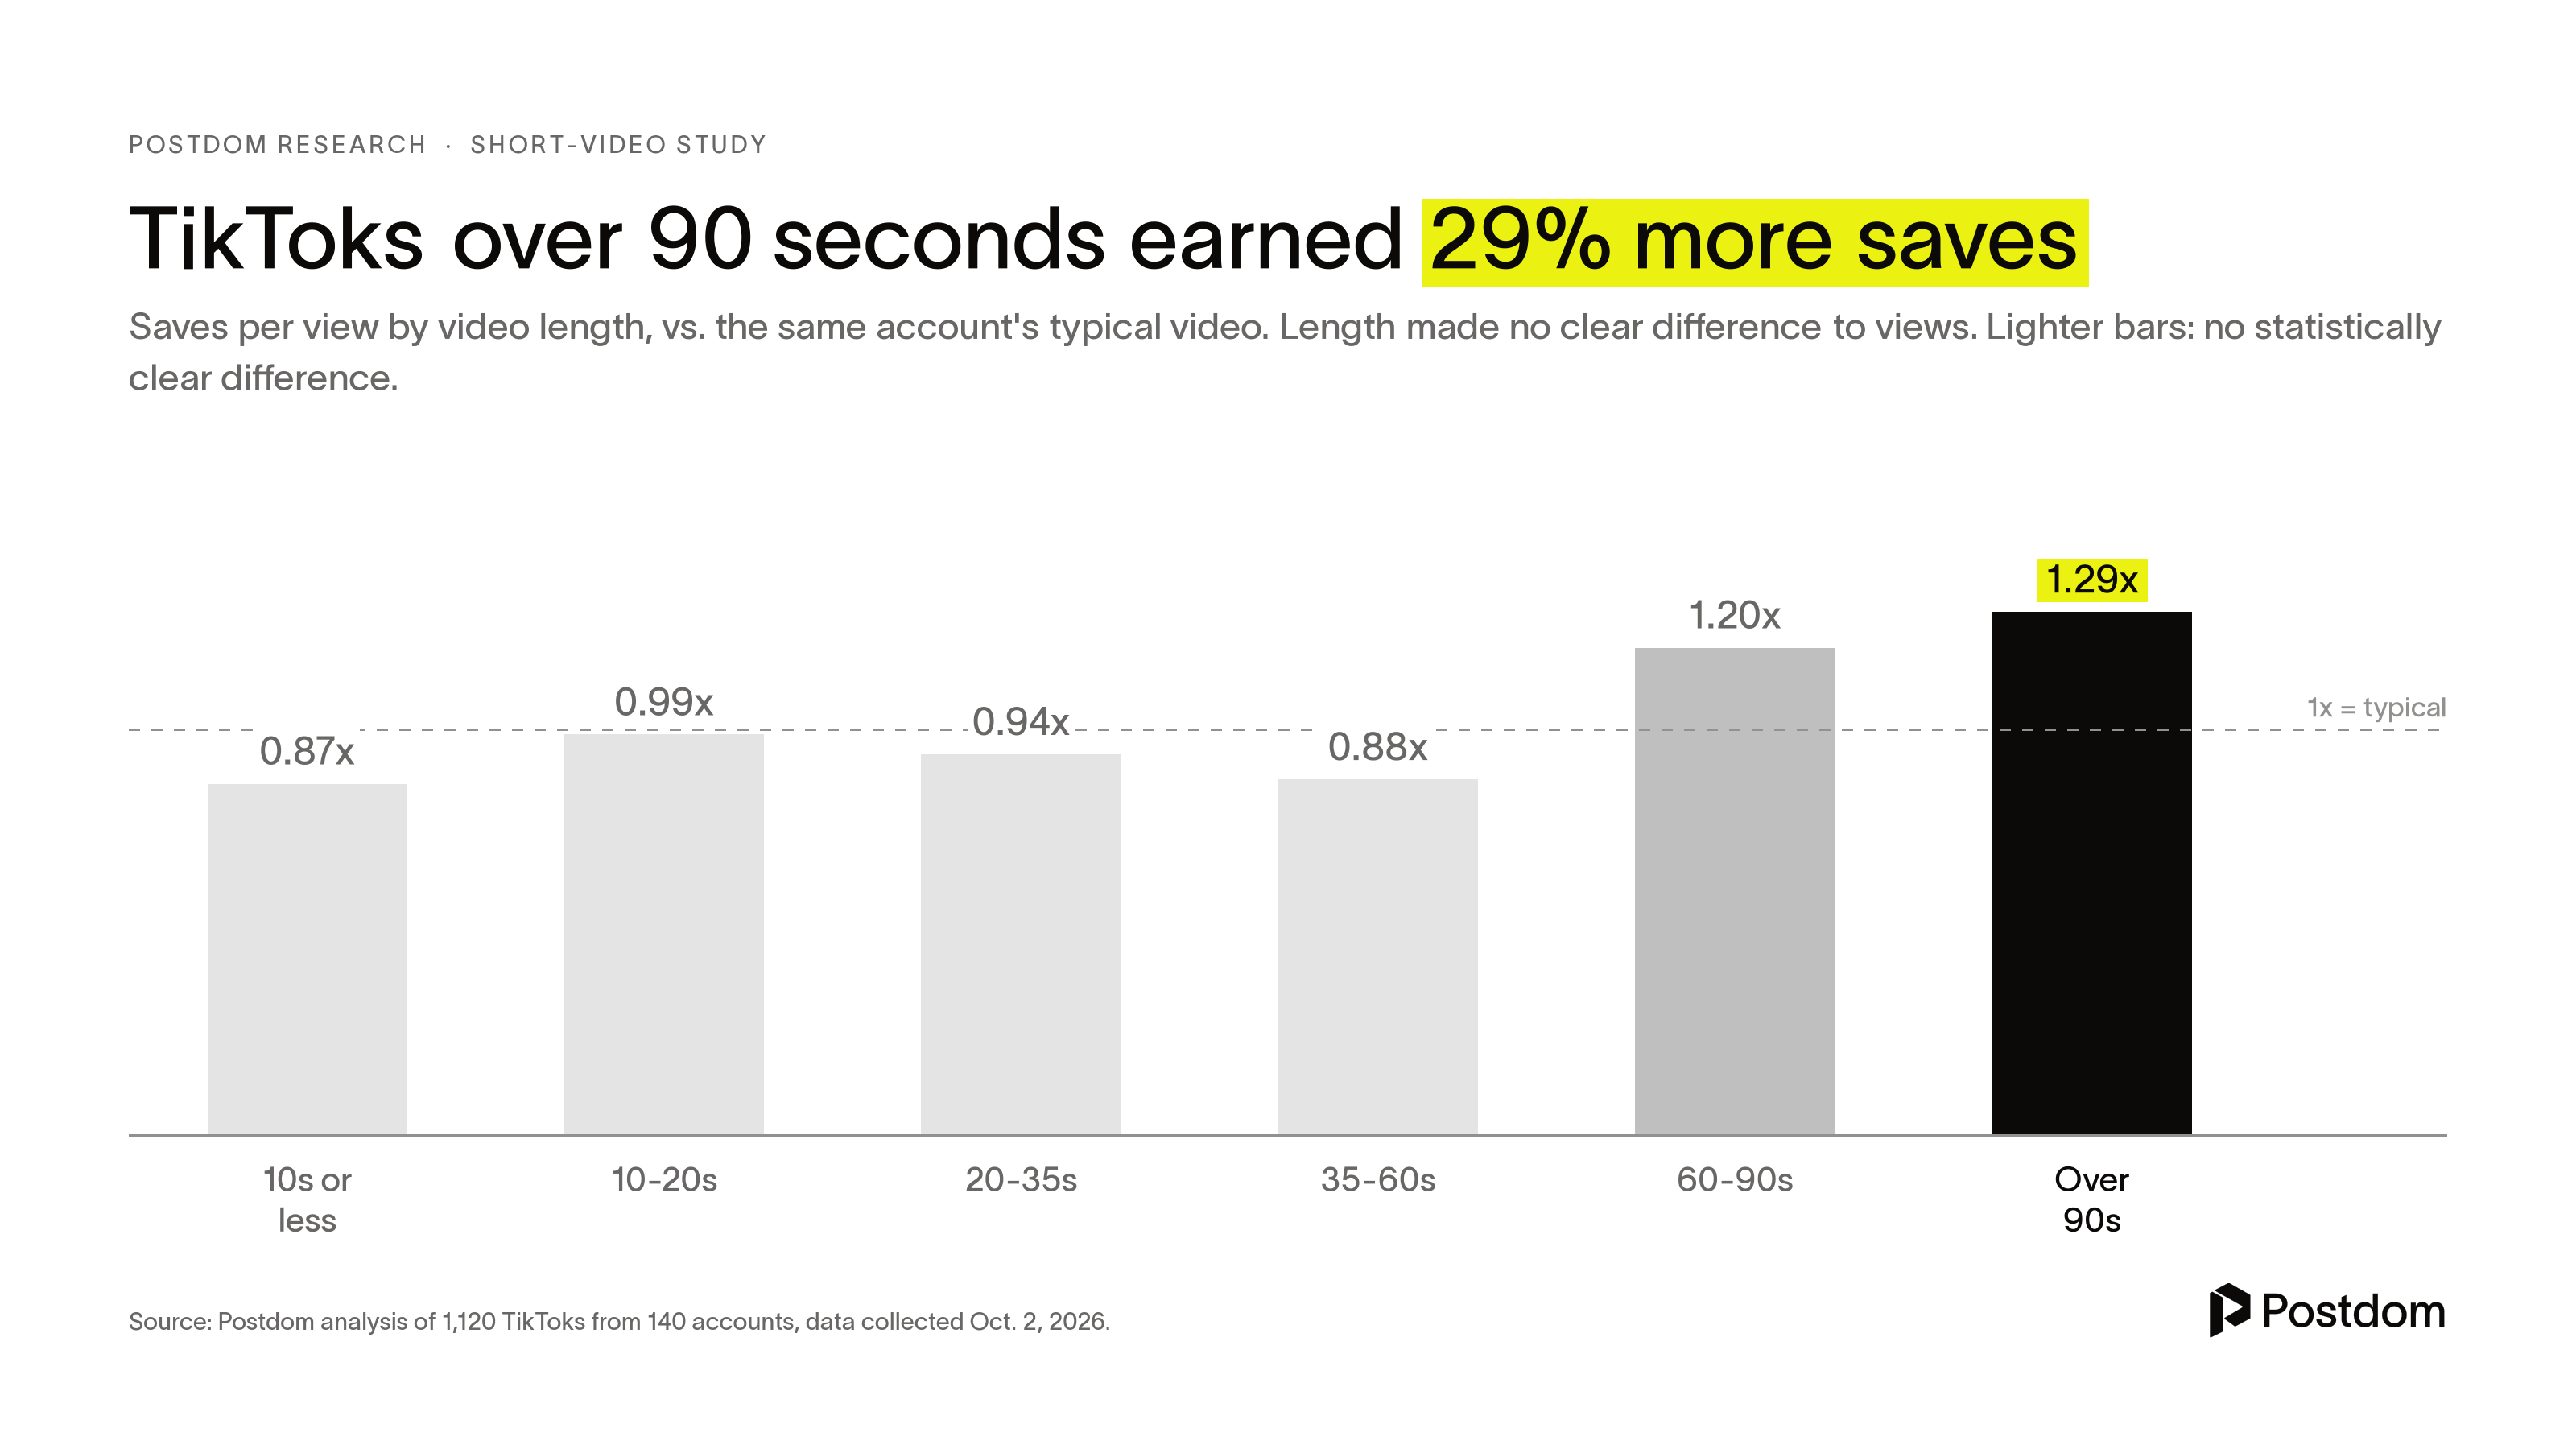
- On TikTok, videos over 90 seconds earned 29% more saves per view.
Postdom studied 1,120 TikToks and 152 Instagram Reels from 160 accounts run by businesses, brands and creators. Big accounts get more views by default, so each video was measured against its own account's median. A score of 2 times means a video drew twice that account's usual audience.
For a sense of scale, Pew Research Center found that 37% of U.S. adults used TikTok in 2025, up from 21% in 2021, and half used Instagram.
A soft invite at the end went with 39% fewer views. A recap drew 52% more
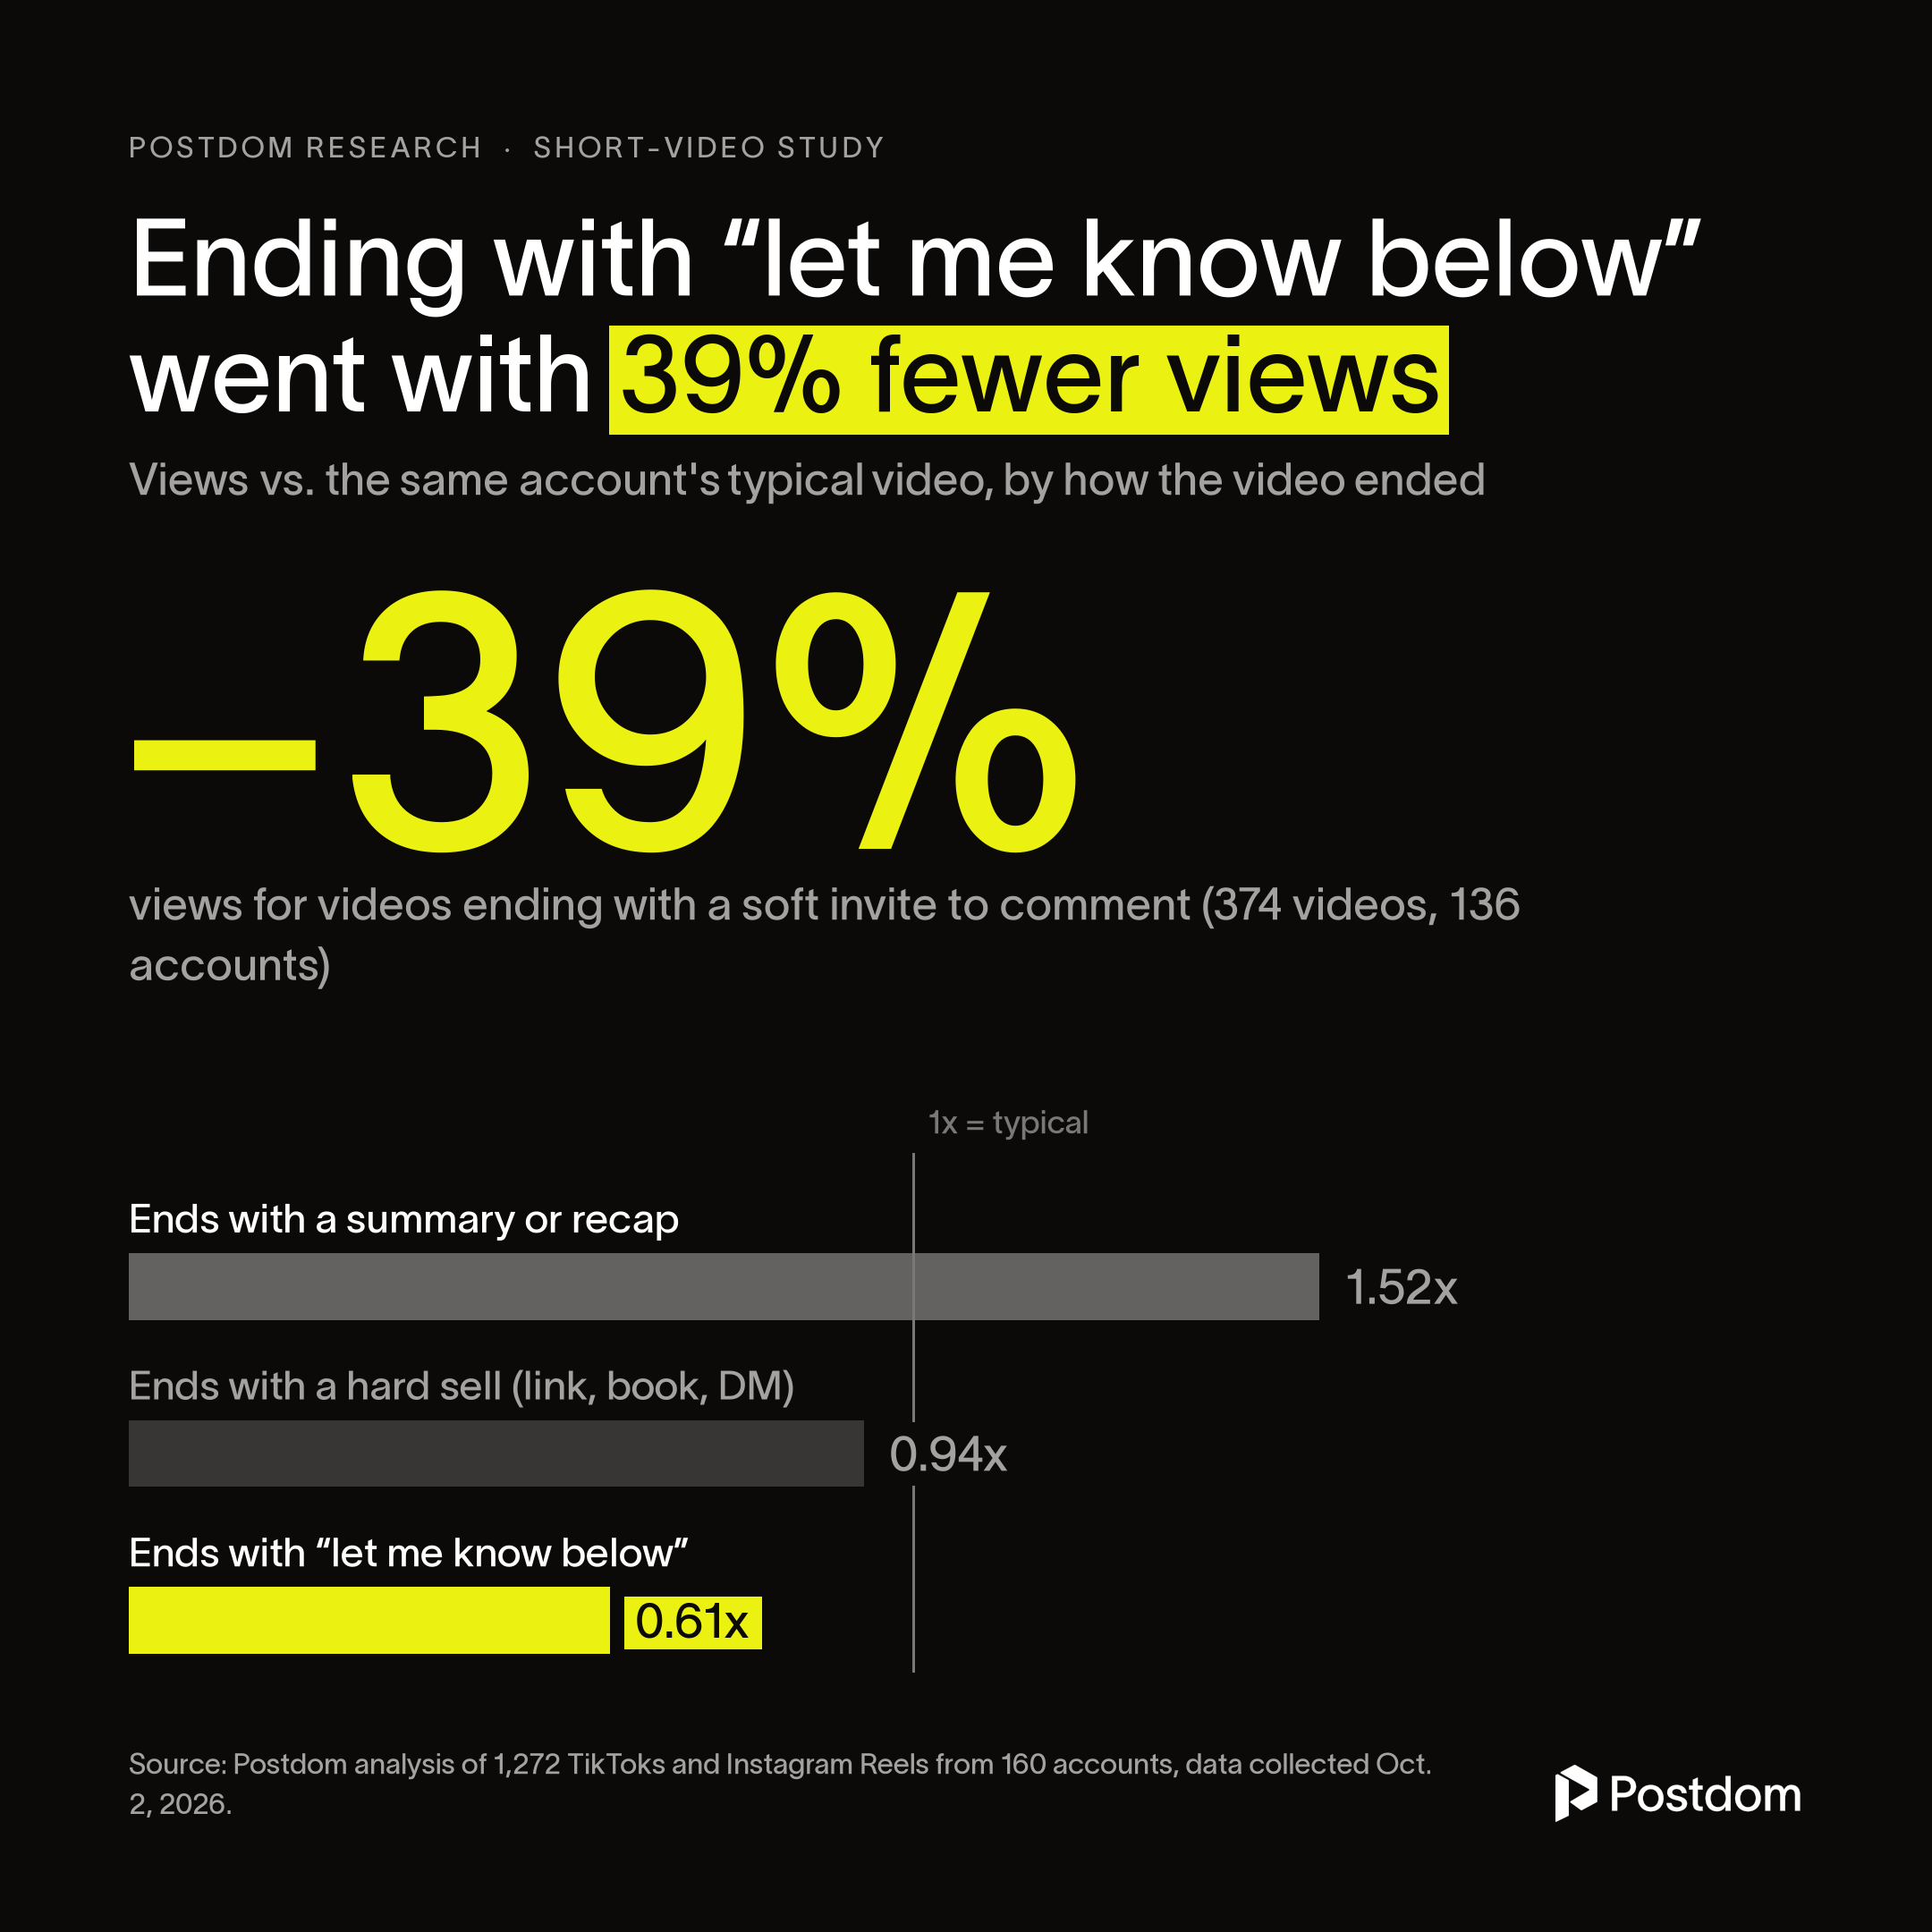
Three in 10 videos in the study ended the same way. The creator asked viewers to "let me know below" or to "come try it." Those videos drew 0.61 times their account's typical views, or 39% fewer (374 videos, 136 accounts).
Ending with "let me know below" went with 39% fewer views. Ending with a quick recap went with 52% more.
Videos that closed with a quick summary or recap went the other way, at 1.52 times. Hard sells such as "link in bio" or "book now" made no clear difference, at 0.94 times.
The caption data pointed the same way. The 23 captions that ended on a question drew just 0.17 times typical views, the steepest drop in the study, though from a small group. Captions under 60 characters drew 0.60 times. Caption room differs by app, and Postdom keeps a list of character and hashtag limits.
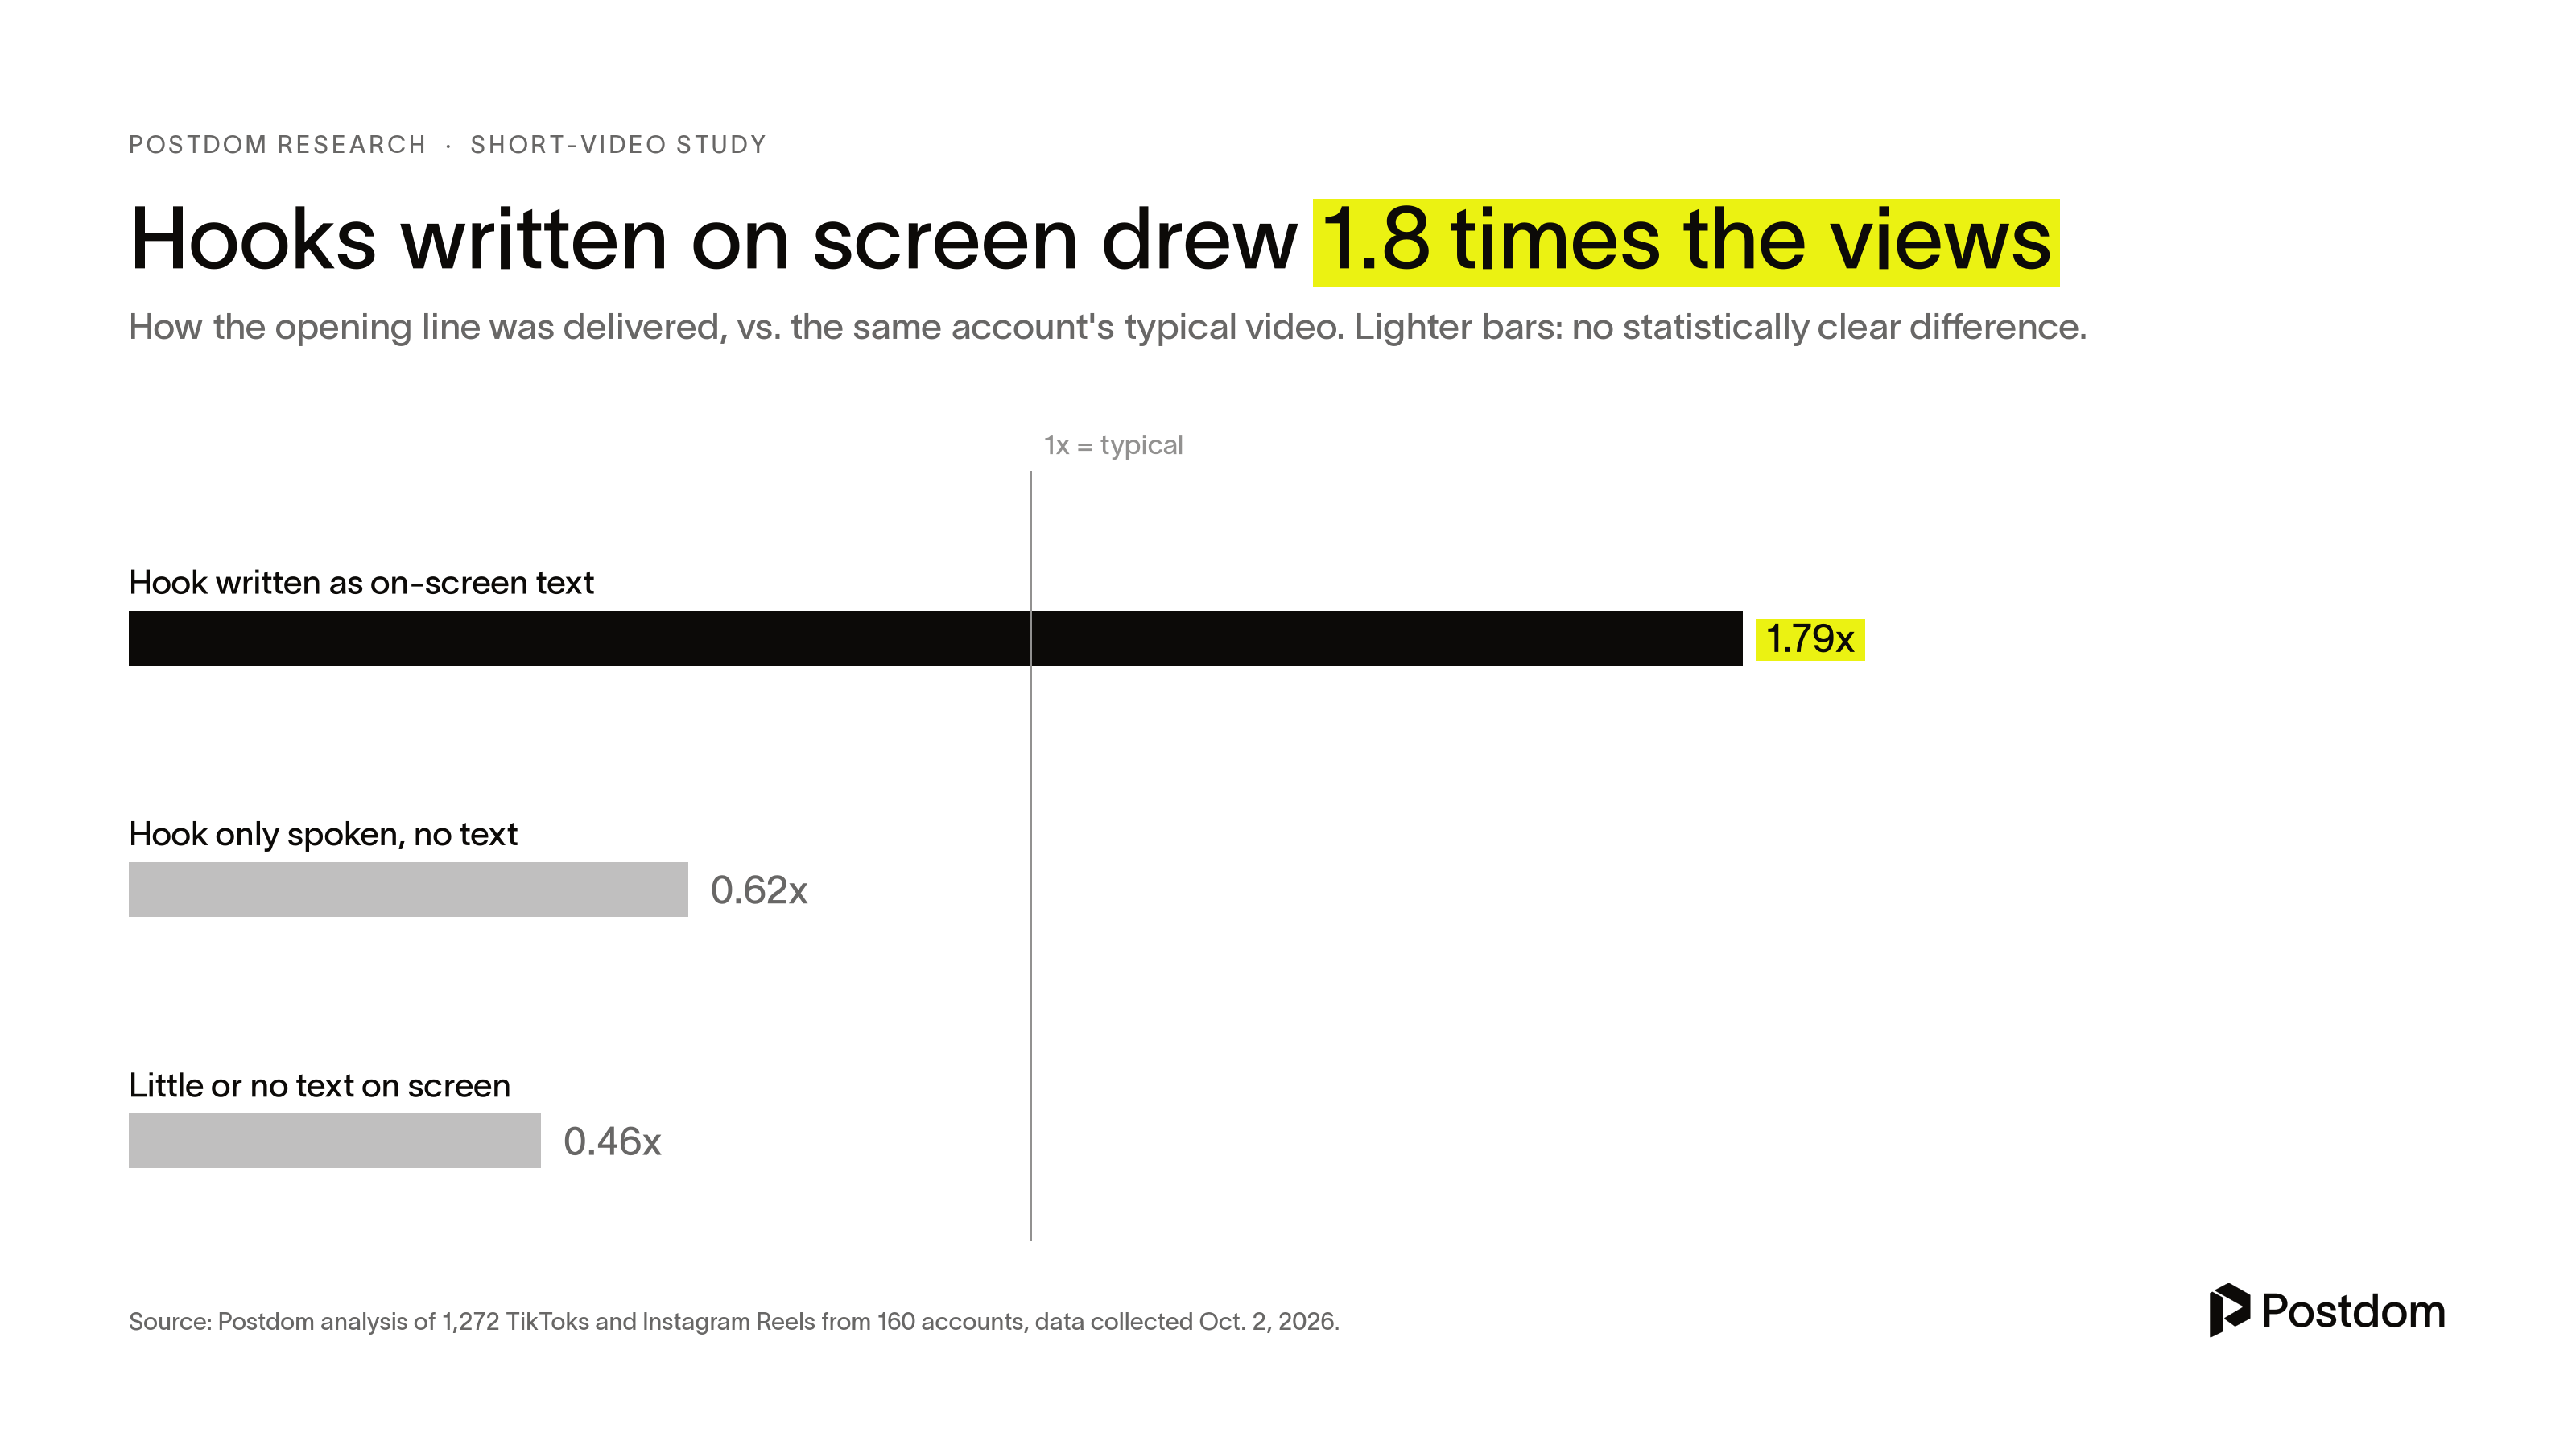
Hooks written on screen drew 1.8 times the views
The clearest signal was whether the opening line appeared as text on screen. Inside the same accounts, those videos drew 1.79 times the account's typical views (500 videos, 82 accounts). Hooks that were only spoken drew 0.62 times.
Videos with almost no text on screen did worst, at 0.46 times. On TikTok they also earned about 30% fewer saves and shares per view.
More text was not always better. Giant title cards that filled the screen drew 0.38 times, though only 27 videos used them. On Instagram, the text effect was smaller and not statistically clear (1.16 times, 58 Reels).
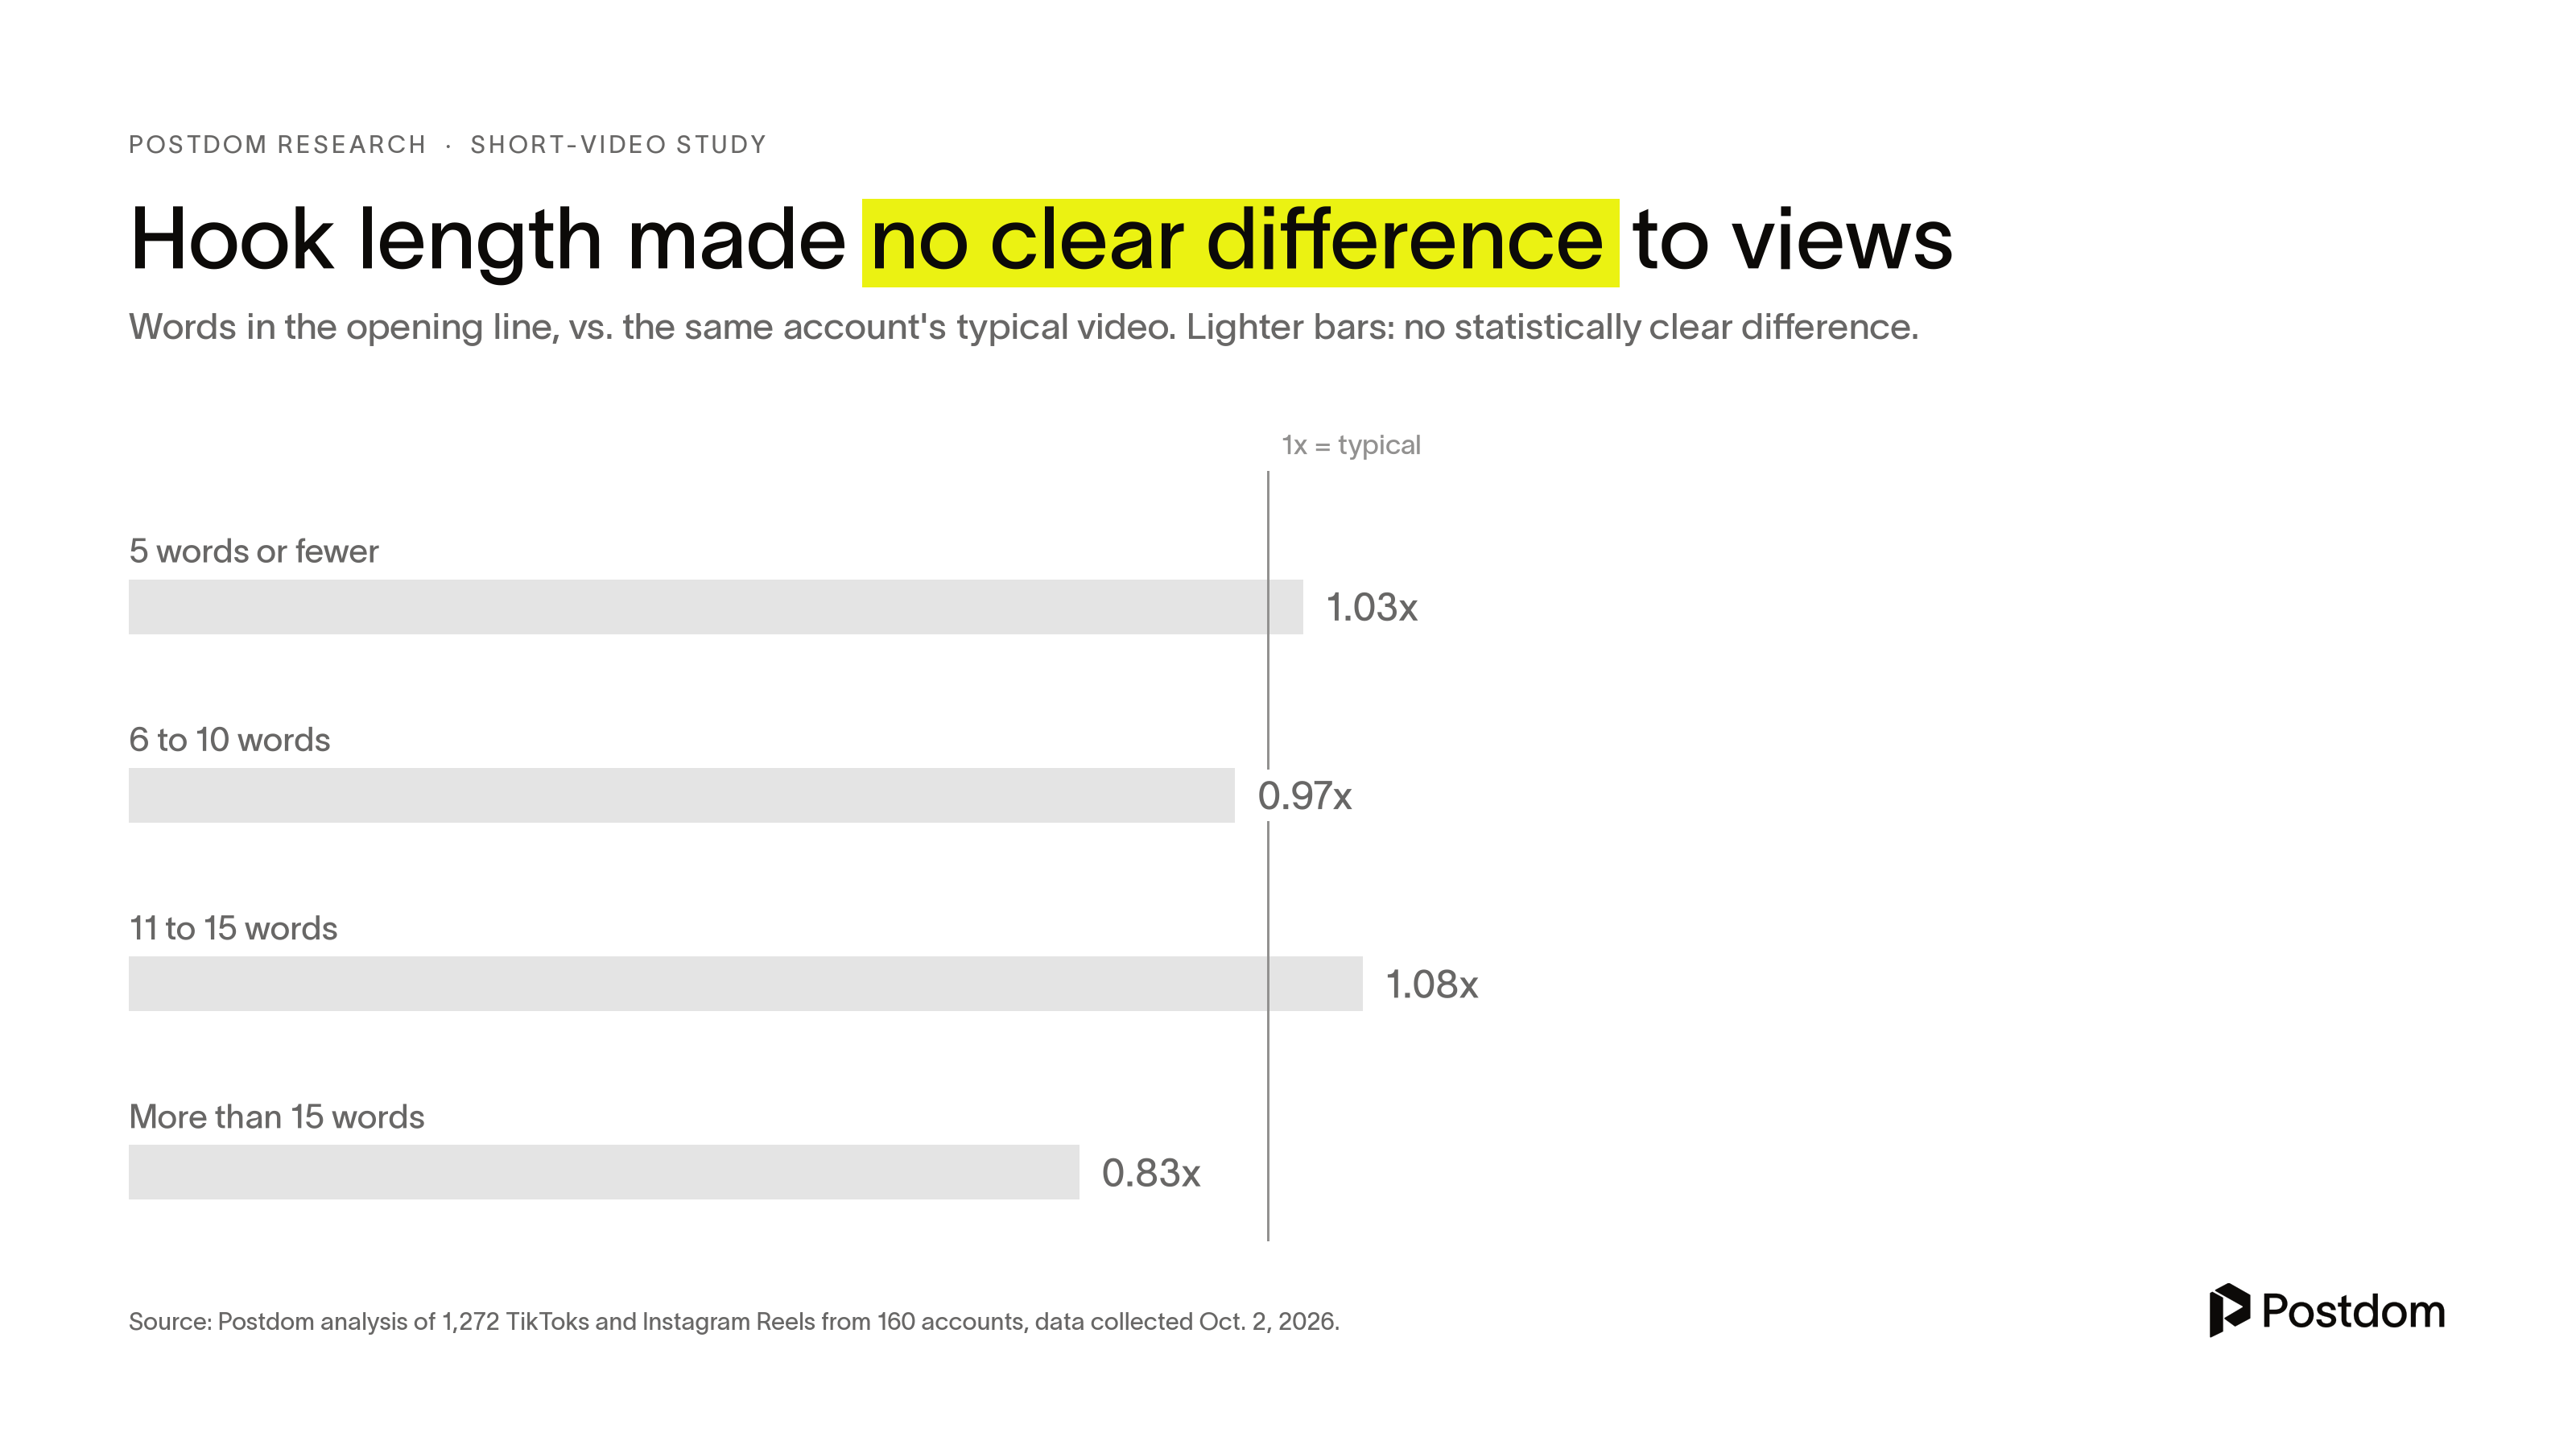
Hook length made no clear difference. Hooks that named a job drew 3 times the views
Posting advice often fixates on how short a hook should be. In this data it made no difference. Hooks of five words or fewer, six to 10, 11 to 15 and more than 15 all landed between 0.83 and 1.08 times typical views, and none stood out.
What the hook said mattered more. Hooks that opened with the speaker's job or role, such as "as a dentist," drew 3.16 times typical views. That figure comes from a small group (30 videos, 18 accounts) and has a wide margin of error.
First-person story hooks drew 1.74 times typical views (135 videos). The median hook ran seven words.
Opening on a real place drew 2.3 times the views
Then there is the first frame. Videos that opened on a real place, such as a street, a room or a view, drew 2.28 times their account's typical views (112 videos, 64 accounts). Opening on a product or object close-up drew 0.56 times.
A person in the first frame made no difference on average, at 1.00 times. Who the person was mattered more. The account's usual presenter went with 1.40 times typical views, while a different person, such as a model or a guest, went with 0.69 times.
Listicles drew 2.1 times the views. One-take videos drew 0.7
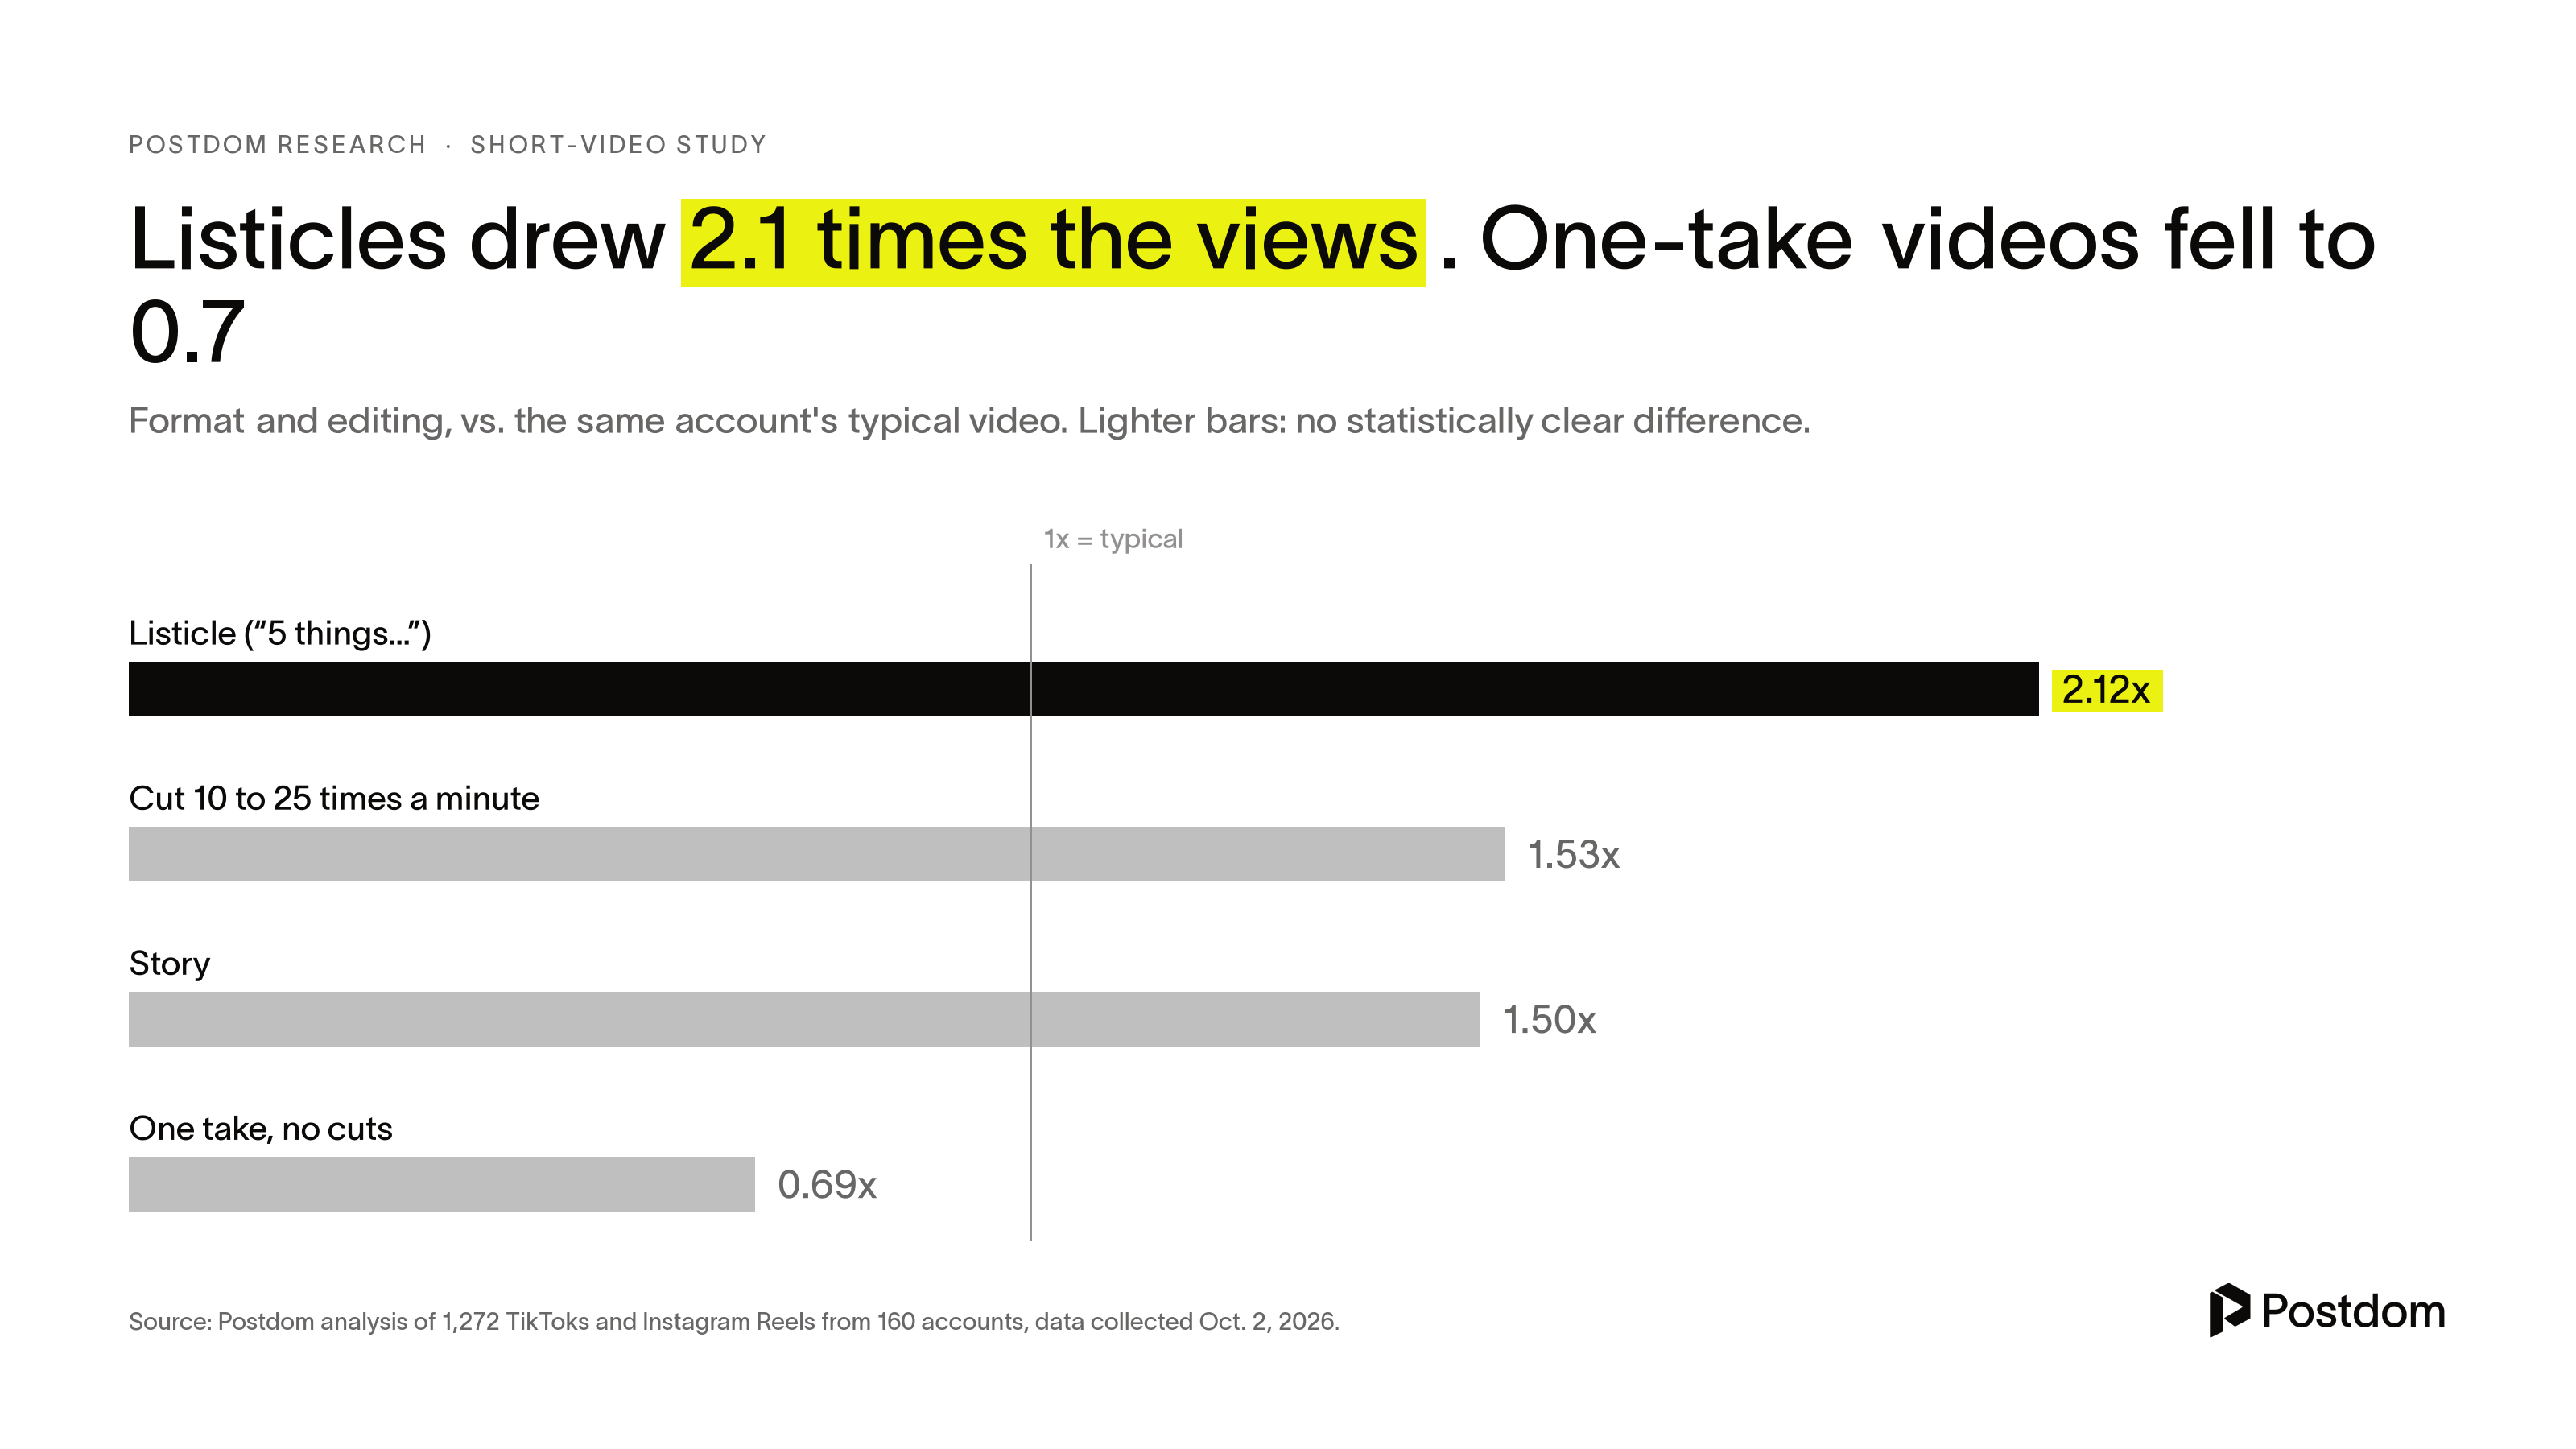
Lists worked. Listicles drew 2.12 times their account's typical views (95 videos, 61 accounts) and earned 39% more saves per view on TikTok. Story-led videos drew 1.50 times.
Editing pace mattered as well. Videos shot in one take with no cuts drew 0.69 times typical views. Videos cut 10 to 25 times a minute, about a new shot every 2.5 to 6 seconds, drew 1.53 times.
Tutorials made no clear difference to views but earned 58% more saves per view on TikTok, a sign that viewers keep them for later.
TikToks over 90 seconds earned 29% more saves
No length, from under 10 seconds to more than 90, was reliably better or worse for views. The median video ran 44 seconds.
Length did change what viewers did after watching. On TikTok, videos over 90 seconds earned 29% more saves and 26% more shares per view than the account's typical video (174 videos, 78 accounts). Videos of 60 to 90 seconds earned 20% more saves.
The 35- to 60-second range was the weak spot for sharing, with 22% fewer shares per view.
84% of accounts had a video that drew 10 times their usual views
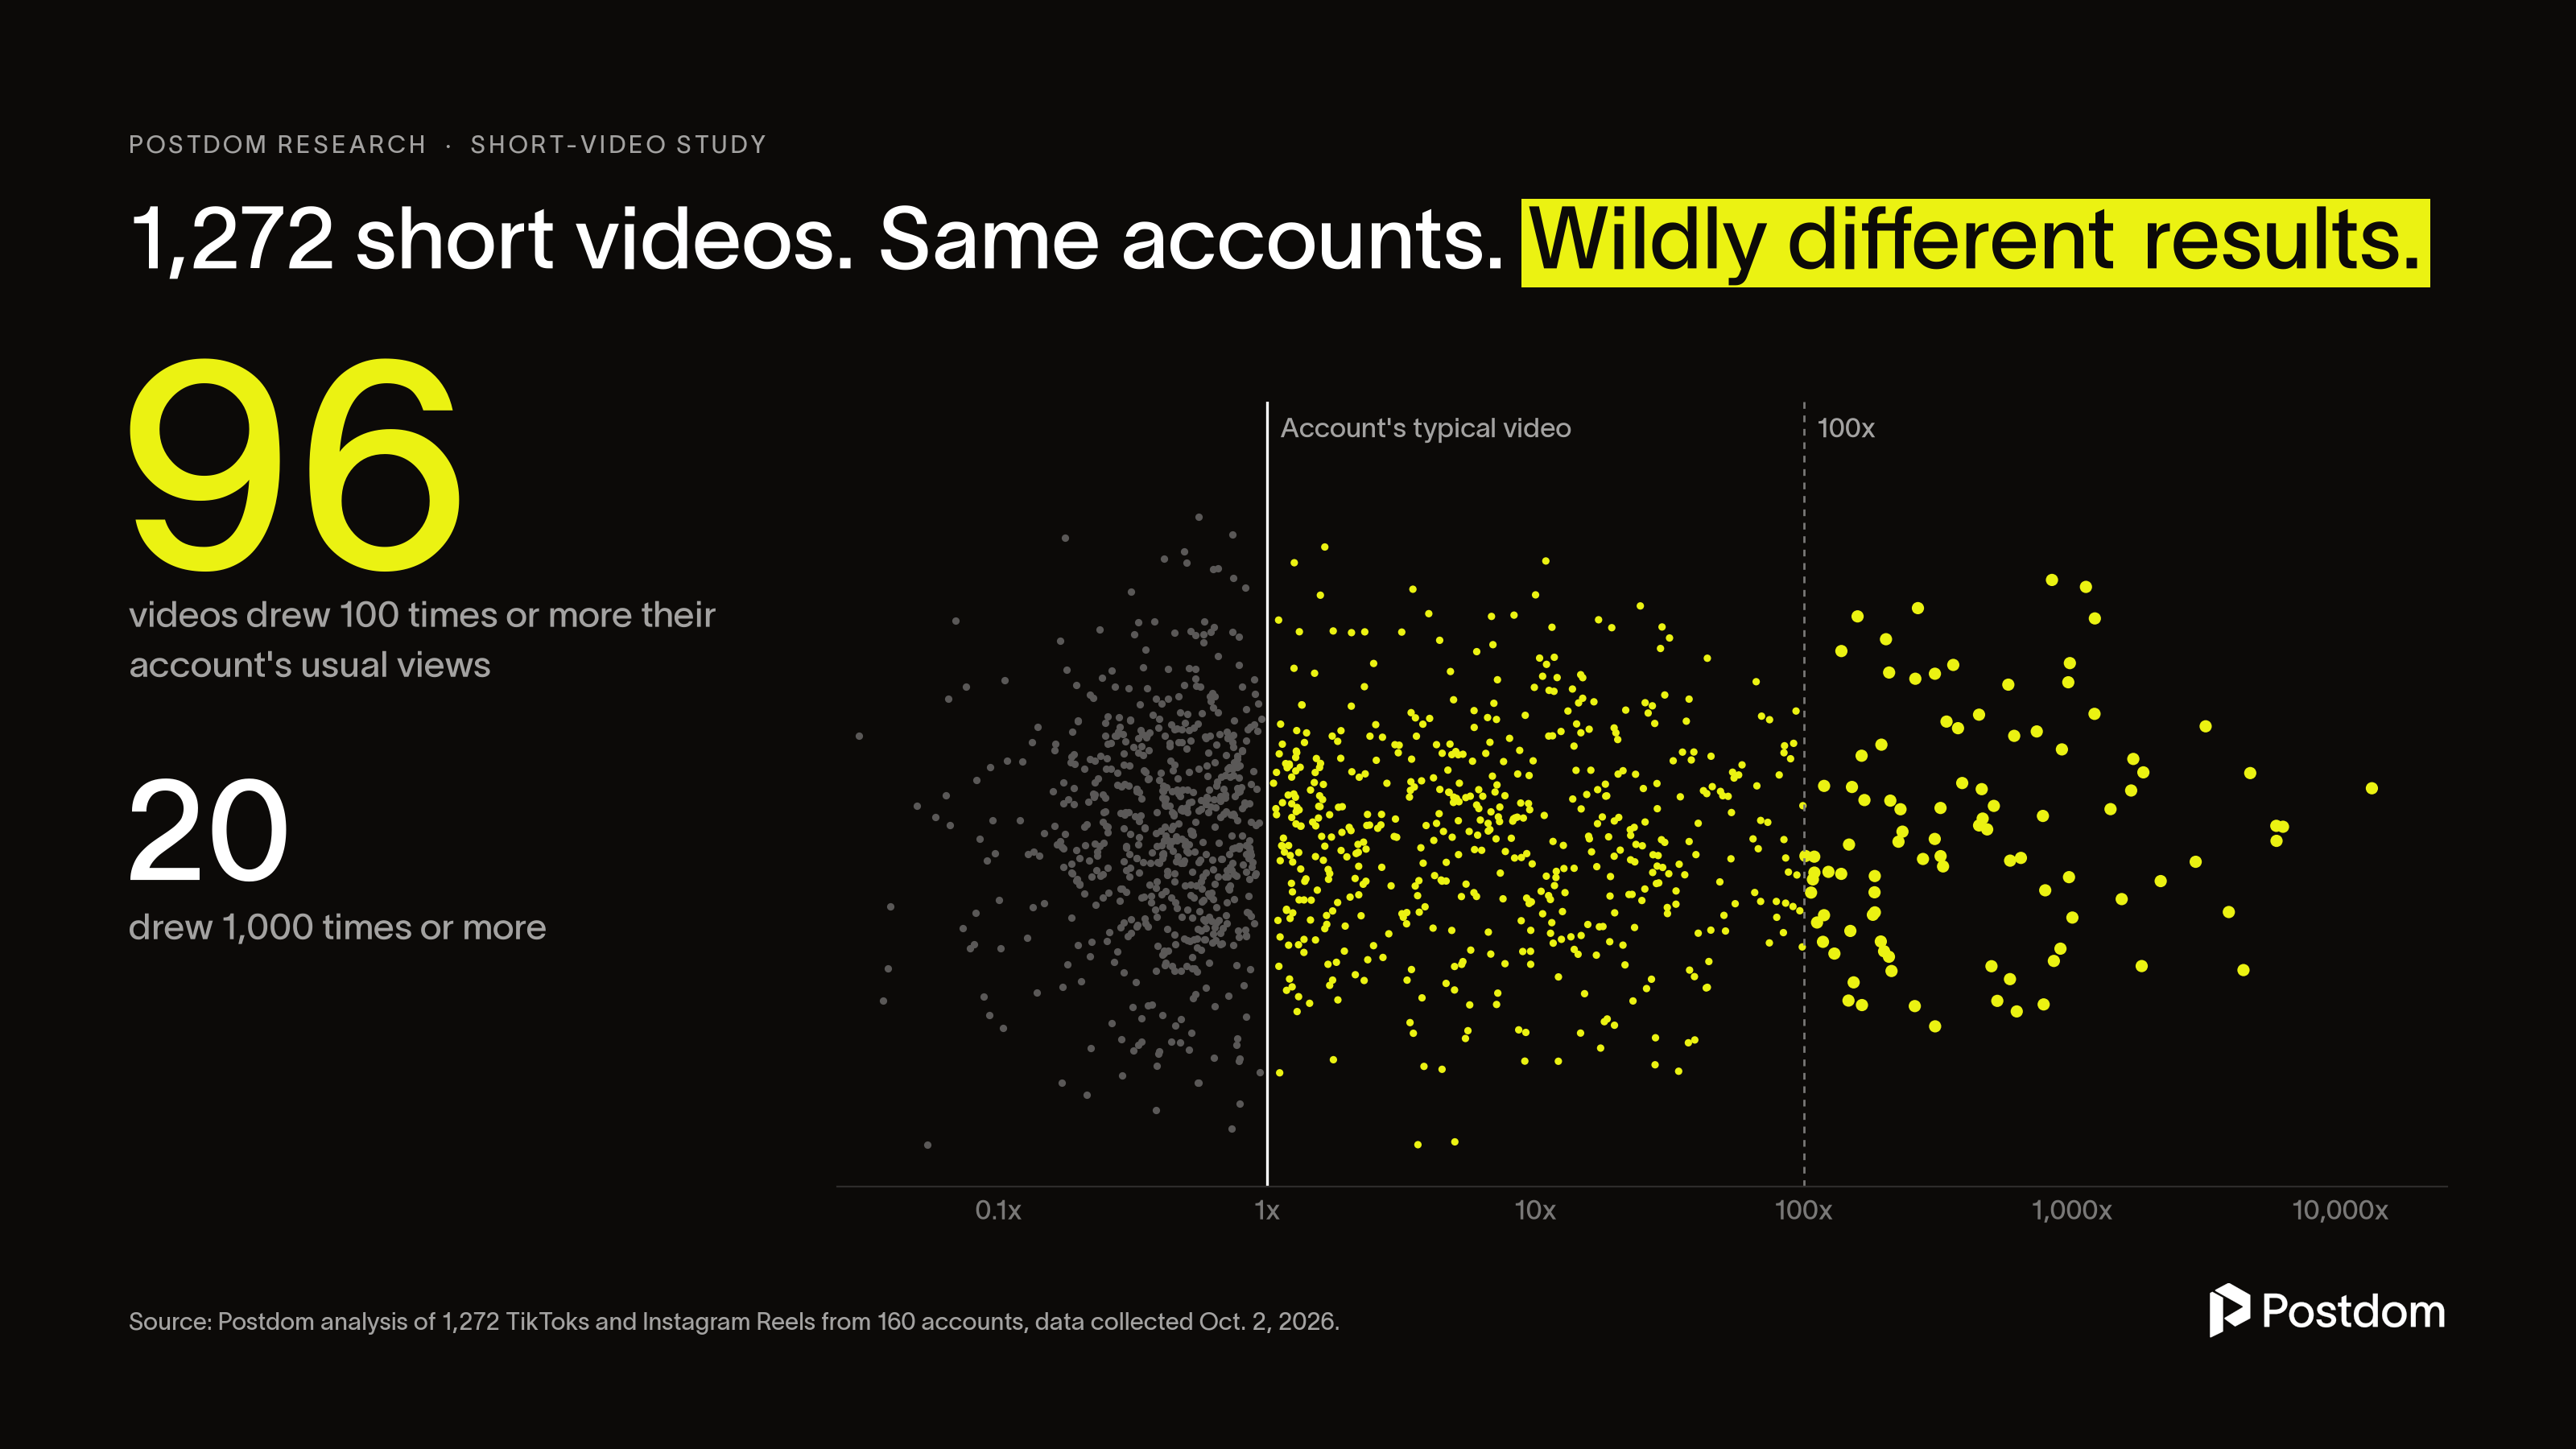
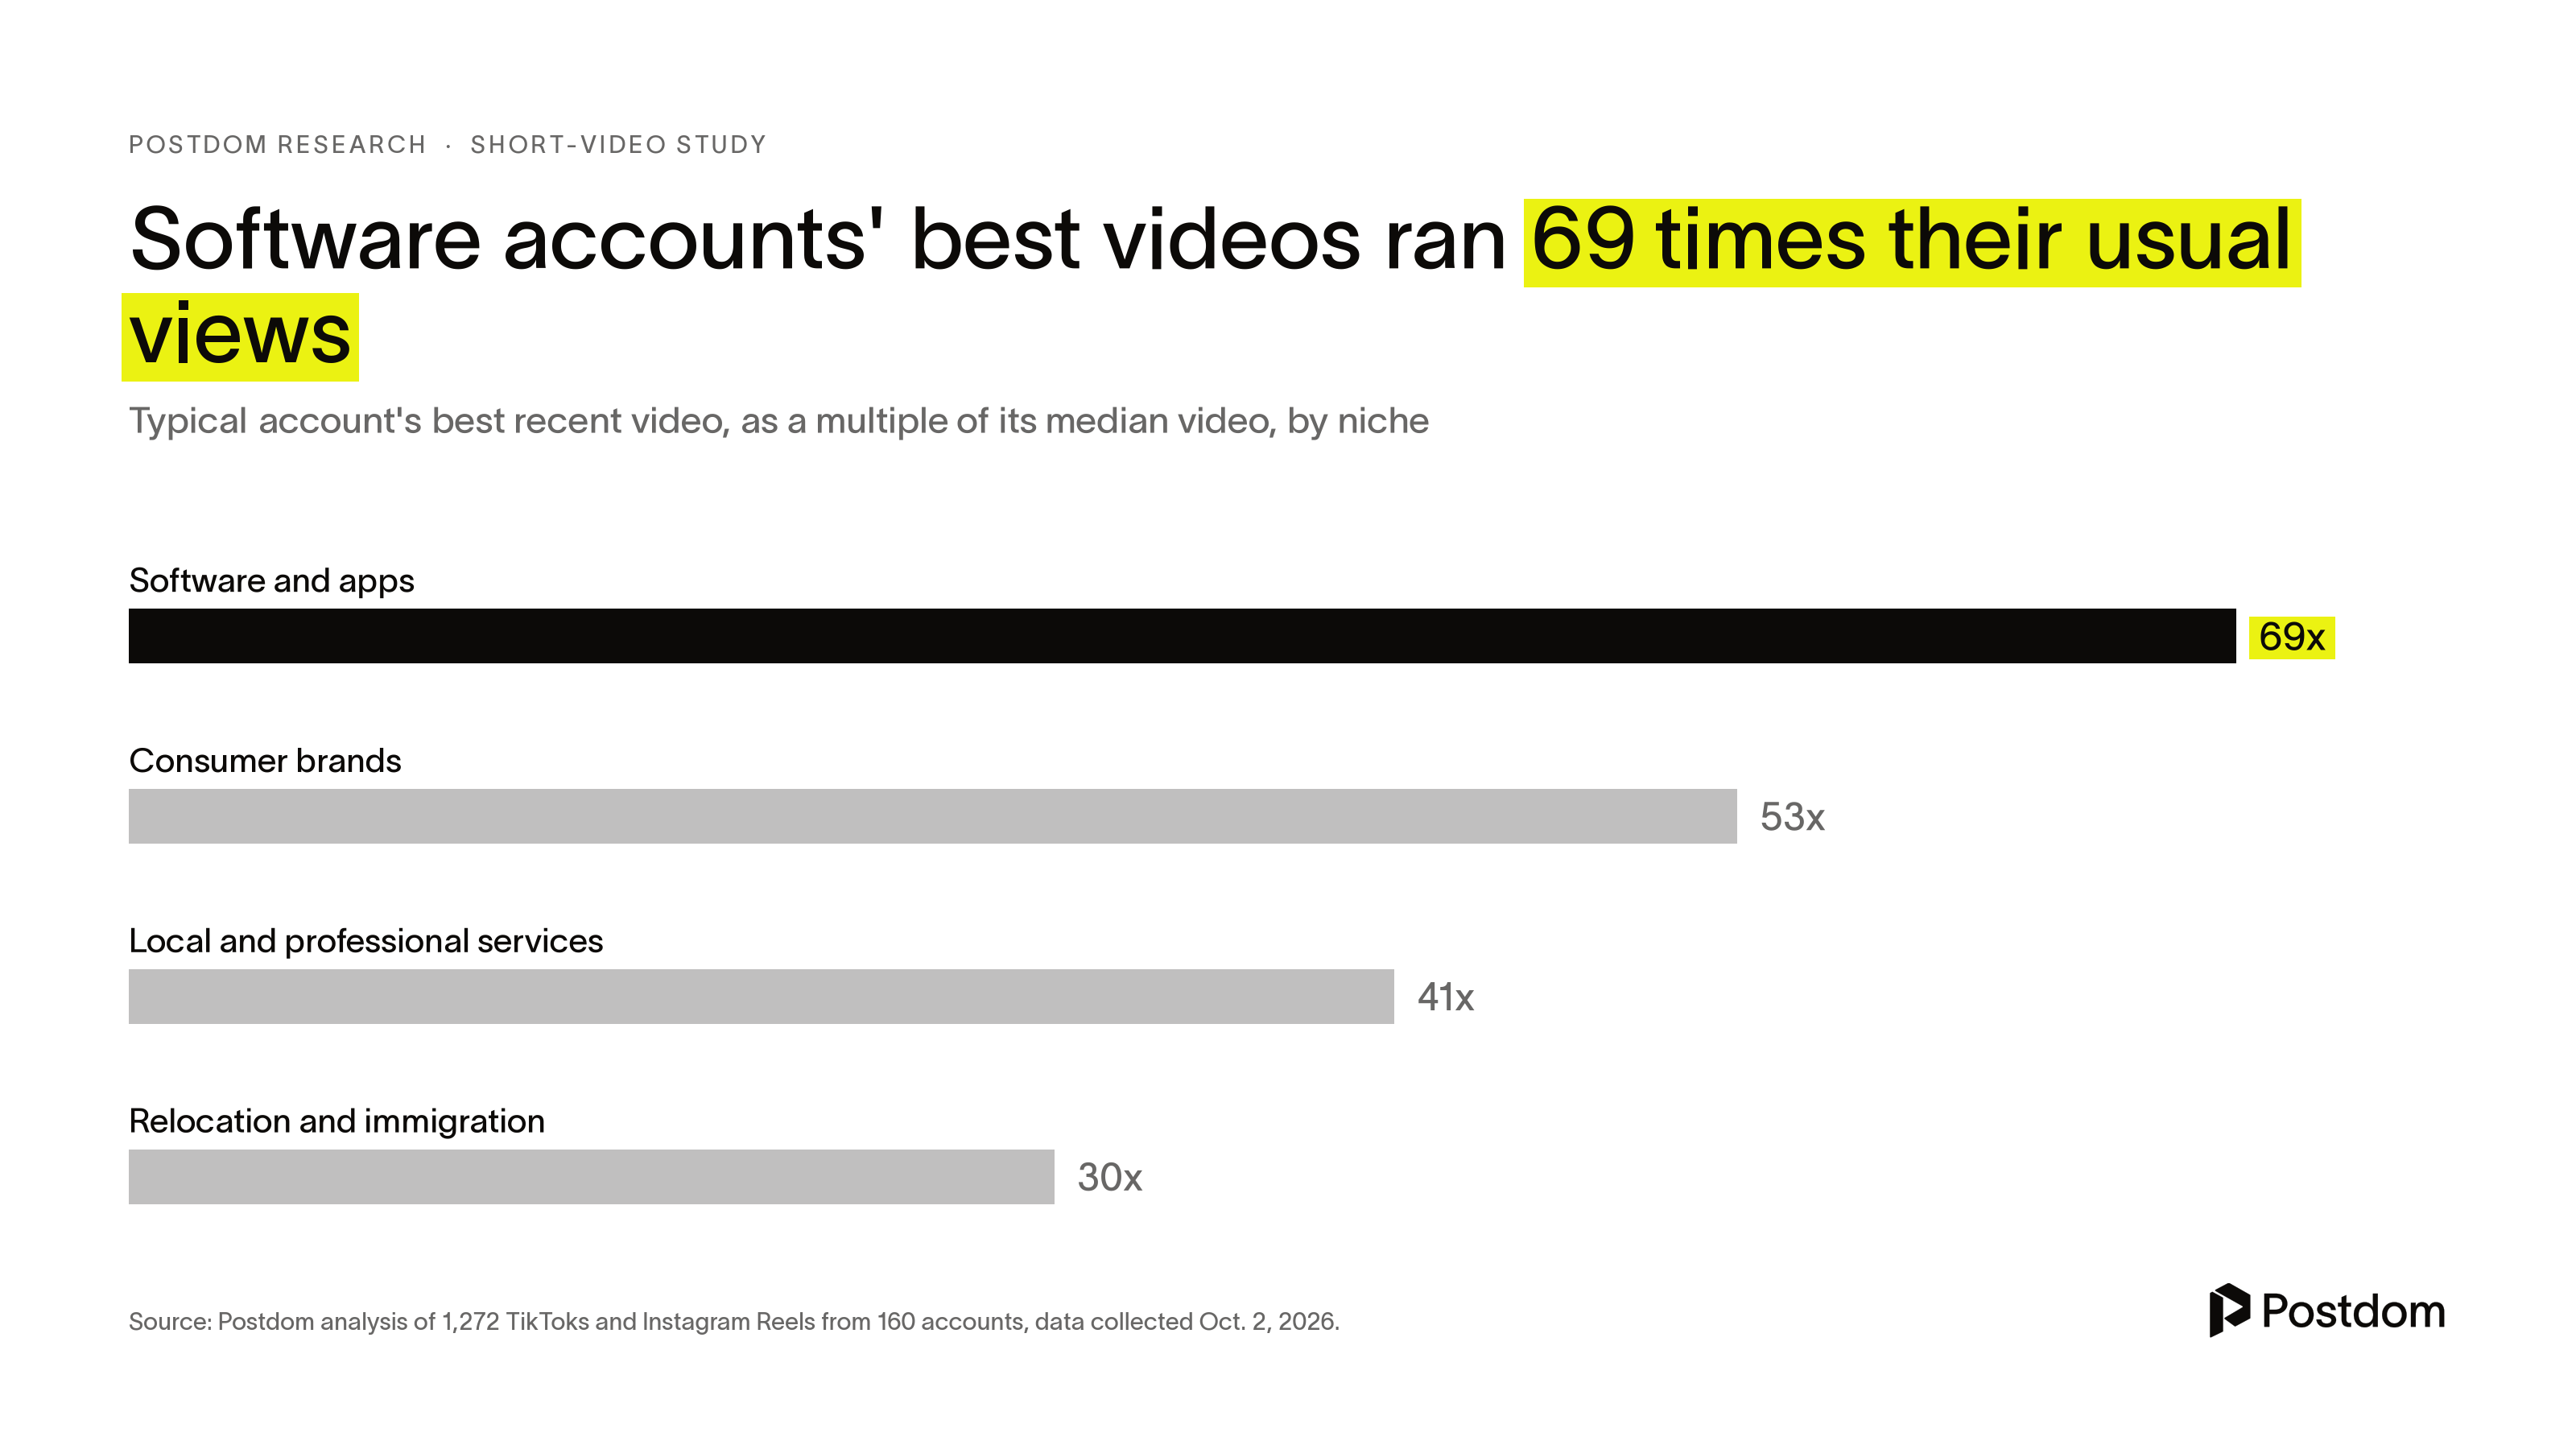
Breakouts were the norm. The typical account's best recent video drew 42 times the views of its median one, and 84% of the 160 accounts had at least one video that cleared 10 times. In the sample, 96 videos topped 100 times their account's usual audience and 20 topped 1,000 times.
These were mostly modest accounts. The typical TikTok account had about 28,000 followers, and the typical account's median video drew about 3,000 views.
Software and app accounts ran furthest, with the typical best video at 69 times the median. Consumer brands followed at 53 times, local and professional services at 41 and relocation and immigration at 30. Accounts in all four niches posted a similar number of videos, so volume does not explain the gap.
For local businesses, list videos drew 4.4 times the usual views
Local and professional service accounts had the biggest everyday audiences in the study. Their typical account's median video drew about 6,000 views. In the other three niches, that figure ranged from about 2,300 to 3,200.
For these accounts, listicles stood out. They drew 4.36 times typical views (31 videos, 21 accounts), though the margin of error is wide. Story hooks did best for software accounts (2.82 times), and the usual presenter mattered most for consumer brands (2.17 times).
These niche splits rest on smaller groups than the main findings. They show where to test first, not a rule.
Methodology
Postdom collected public data on Oct. 2, 2026. TikTok accounts were found through 91 searches across four niches and screened for posting their own footage with in-app text. A further 20 Instagram brand and business accounts in the same niches were added by hand. The final set was 1,120 TikToks from 140 accounts and 152 Reels from 20 accounts: 849 videos from business owners, 136 from brand accounts and 287 from creators. Of those videos, 76% were posted in 2026.
Each eligible video (not an ad, at least seven days old, three minutes or shorter) was compared with the median views of all the same account's eligible videos. From each account, the three best, three worst and two middle-ranked videos were analyzed. Because extremes were deliberately sampled, multipliers are inflated. The direction of each finding is more reliable than its exact size. Effects compare videos with and without a feature inside the same accounts. Ranges are 95% intervals from 2,000 resamples of accounts. Features were labeled from eight frames, an audio transcript and the caption by AI models that did not see view counts. These are correlations, not proof of cause. Full method, charts and data: postdom.com/research.
Sources
- Postdom, "What makes a short video go viral in 2026" (method, charts and data summary): https://postdom.com/research/what-makes-a-video-go-viral
- Pew Research Center, "Americans' Social Media Use 2025" (Nov. 20, 2025): https://www.pewresearch.org/internet/2025/11/20/americans-social-media-use-2025/
- Postdom, Character and hashtag limits by platform: https://postdom.com/tools/character-and-hashtag-limits
Related
All posts