
Research
Wall of Text Videos on TikTok Get 27% Fewer Views: Data From 60 Business Posts

An analysis of 1,272 TikTok and Instagram videos found only 4 in 10 text-heavy business videos beat their account's norm. Short clips with one line of text topped the ranking.

On this page
Postdom Research | Wall of text videos, October 2026
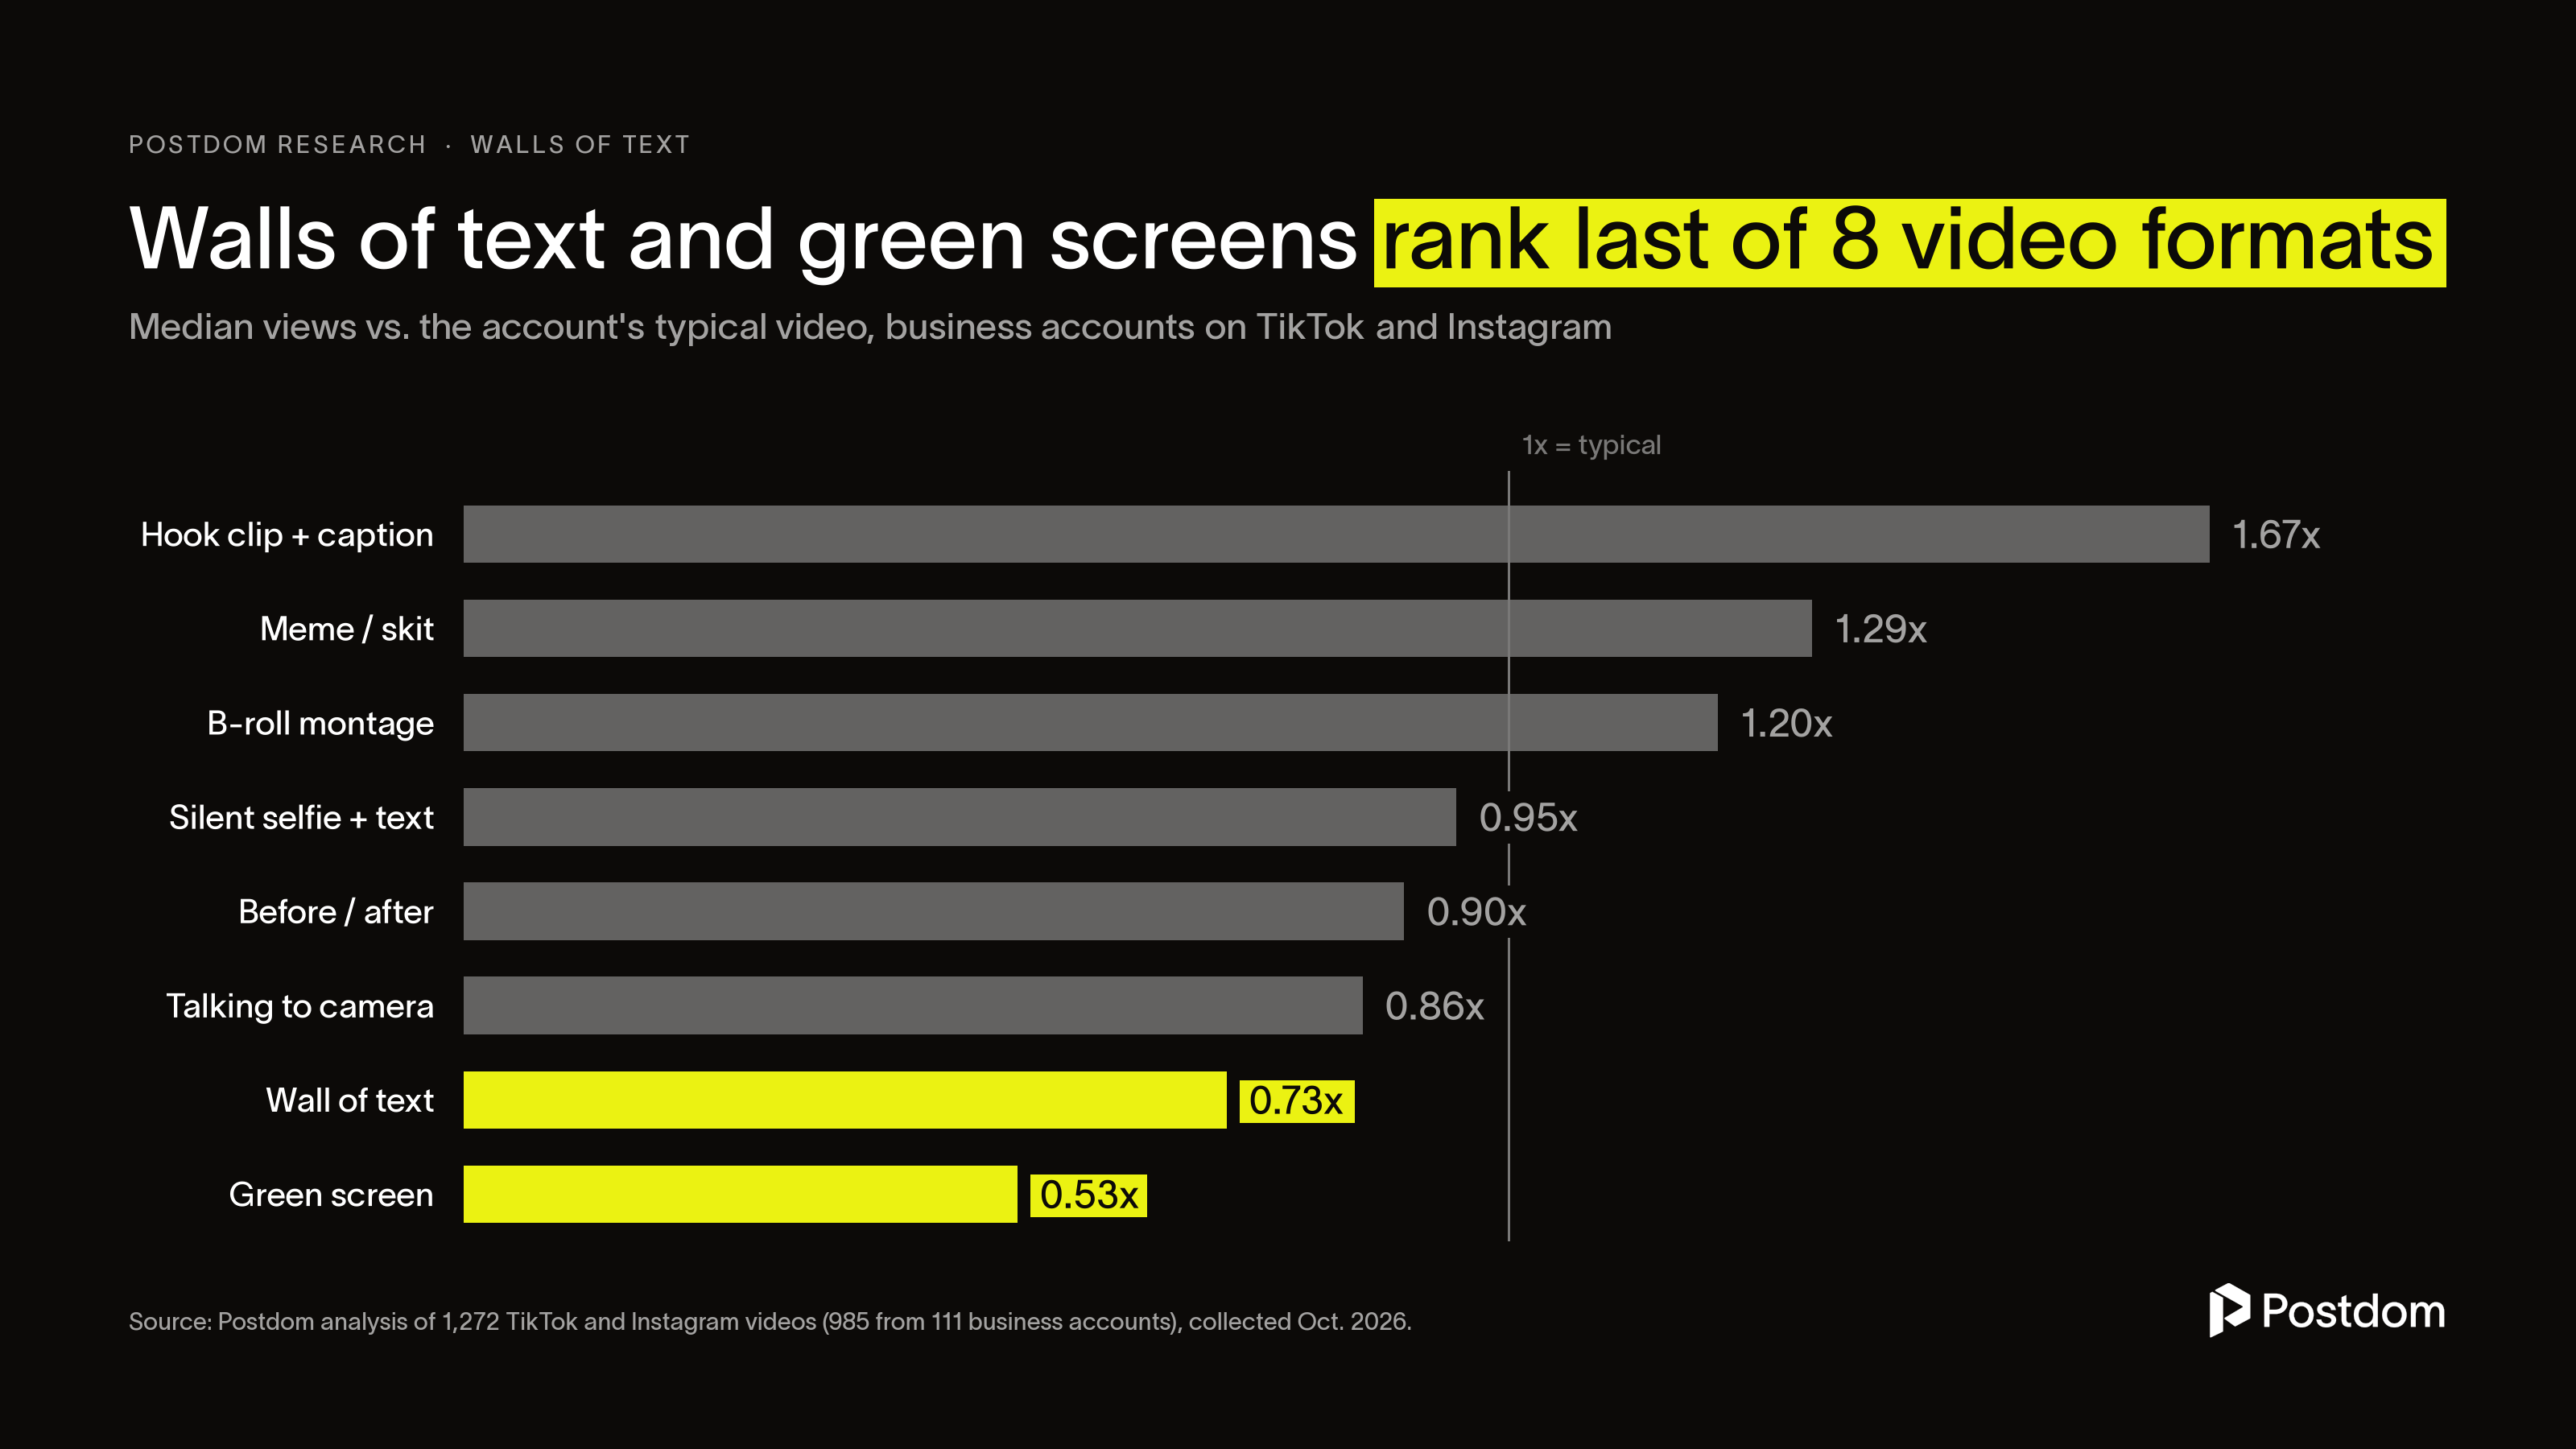
The typical wall-of-text video drew 27% fewer views than the same account's usual post, according to Postdom's analysis of 1,272 TikTok and Instagram videos. People didn't save these videos more often either, which undercuts the main reason businesses make them.
The format is everywhere: a block of tips laid over a stock clip and a music track. It's the default for owners who'd rather not get on camera.
Key findings: wall of text videos
- Walls of text earned a median 0.73x their account's typical views, or 27% fewer. That ranks seventh of eight formats.
- Only 40% of walls of text (24 of 60) beat their account's median. Reaction memes did so 59% of the time.
- They weren't saved more: 11.1 saves per 100 likes, against 12 for all business videos.
- Short hook clips, with one line on screen and the story in the caption, topped the ranking at 1.67x. The sample is small.
- Green-screen explainers did worst, at 0.53x. Only 2 of 14 beat their account's usual views.
27% fewer views: walls of text trail their own account's usual post
Postdom compared every video with the median views of the account that posted it. That puts a small salon and a big software firm on the same scale. A score of 1.0x means a video did as well as that account usually does.
Across 985 videos from 111 business accounts, the typical video landed at 0.96x. The 60 walls of text, from 32 accounts, landed at 0.73x.
Short hook clips (1.67x), reaction memes and skits (1.29x) and b-roll montages with text and music (1.20x) all sat above the line.
The typical wall of text got 27% fewer views than its account's usual post. And people didn't save it any more often.
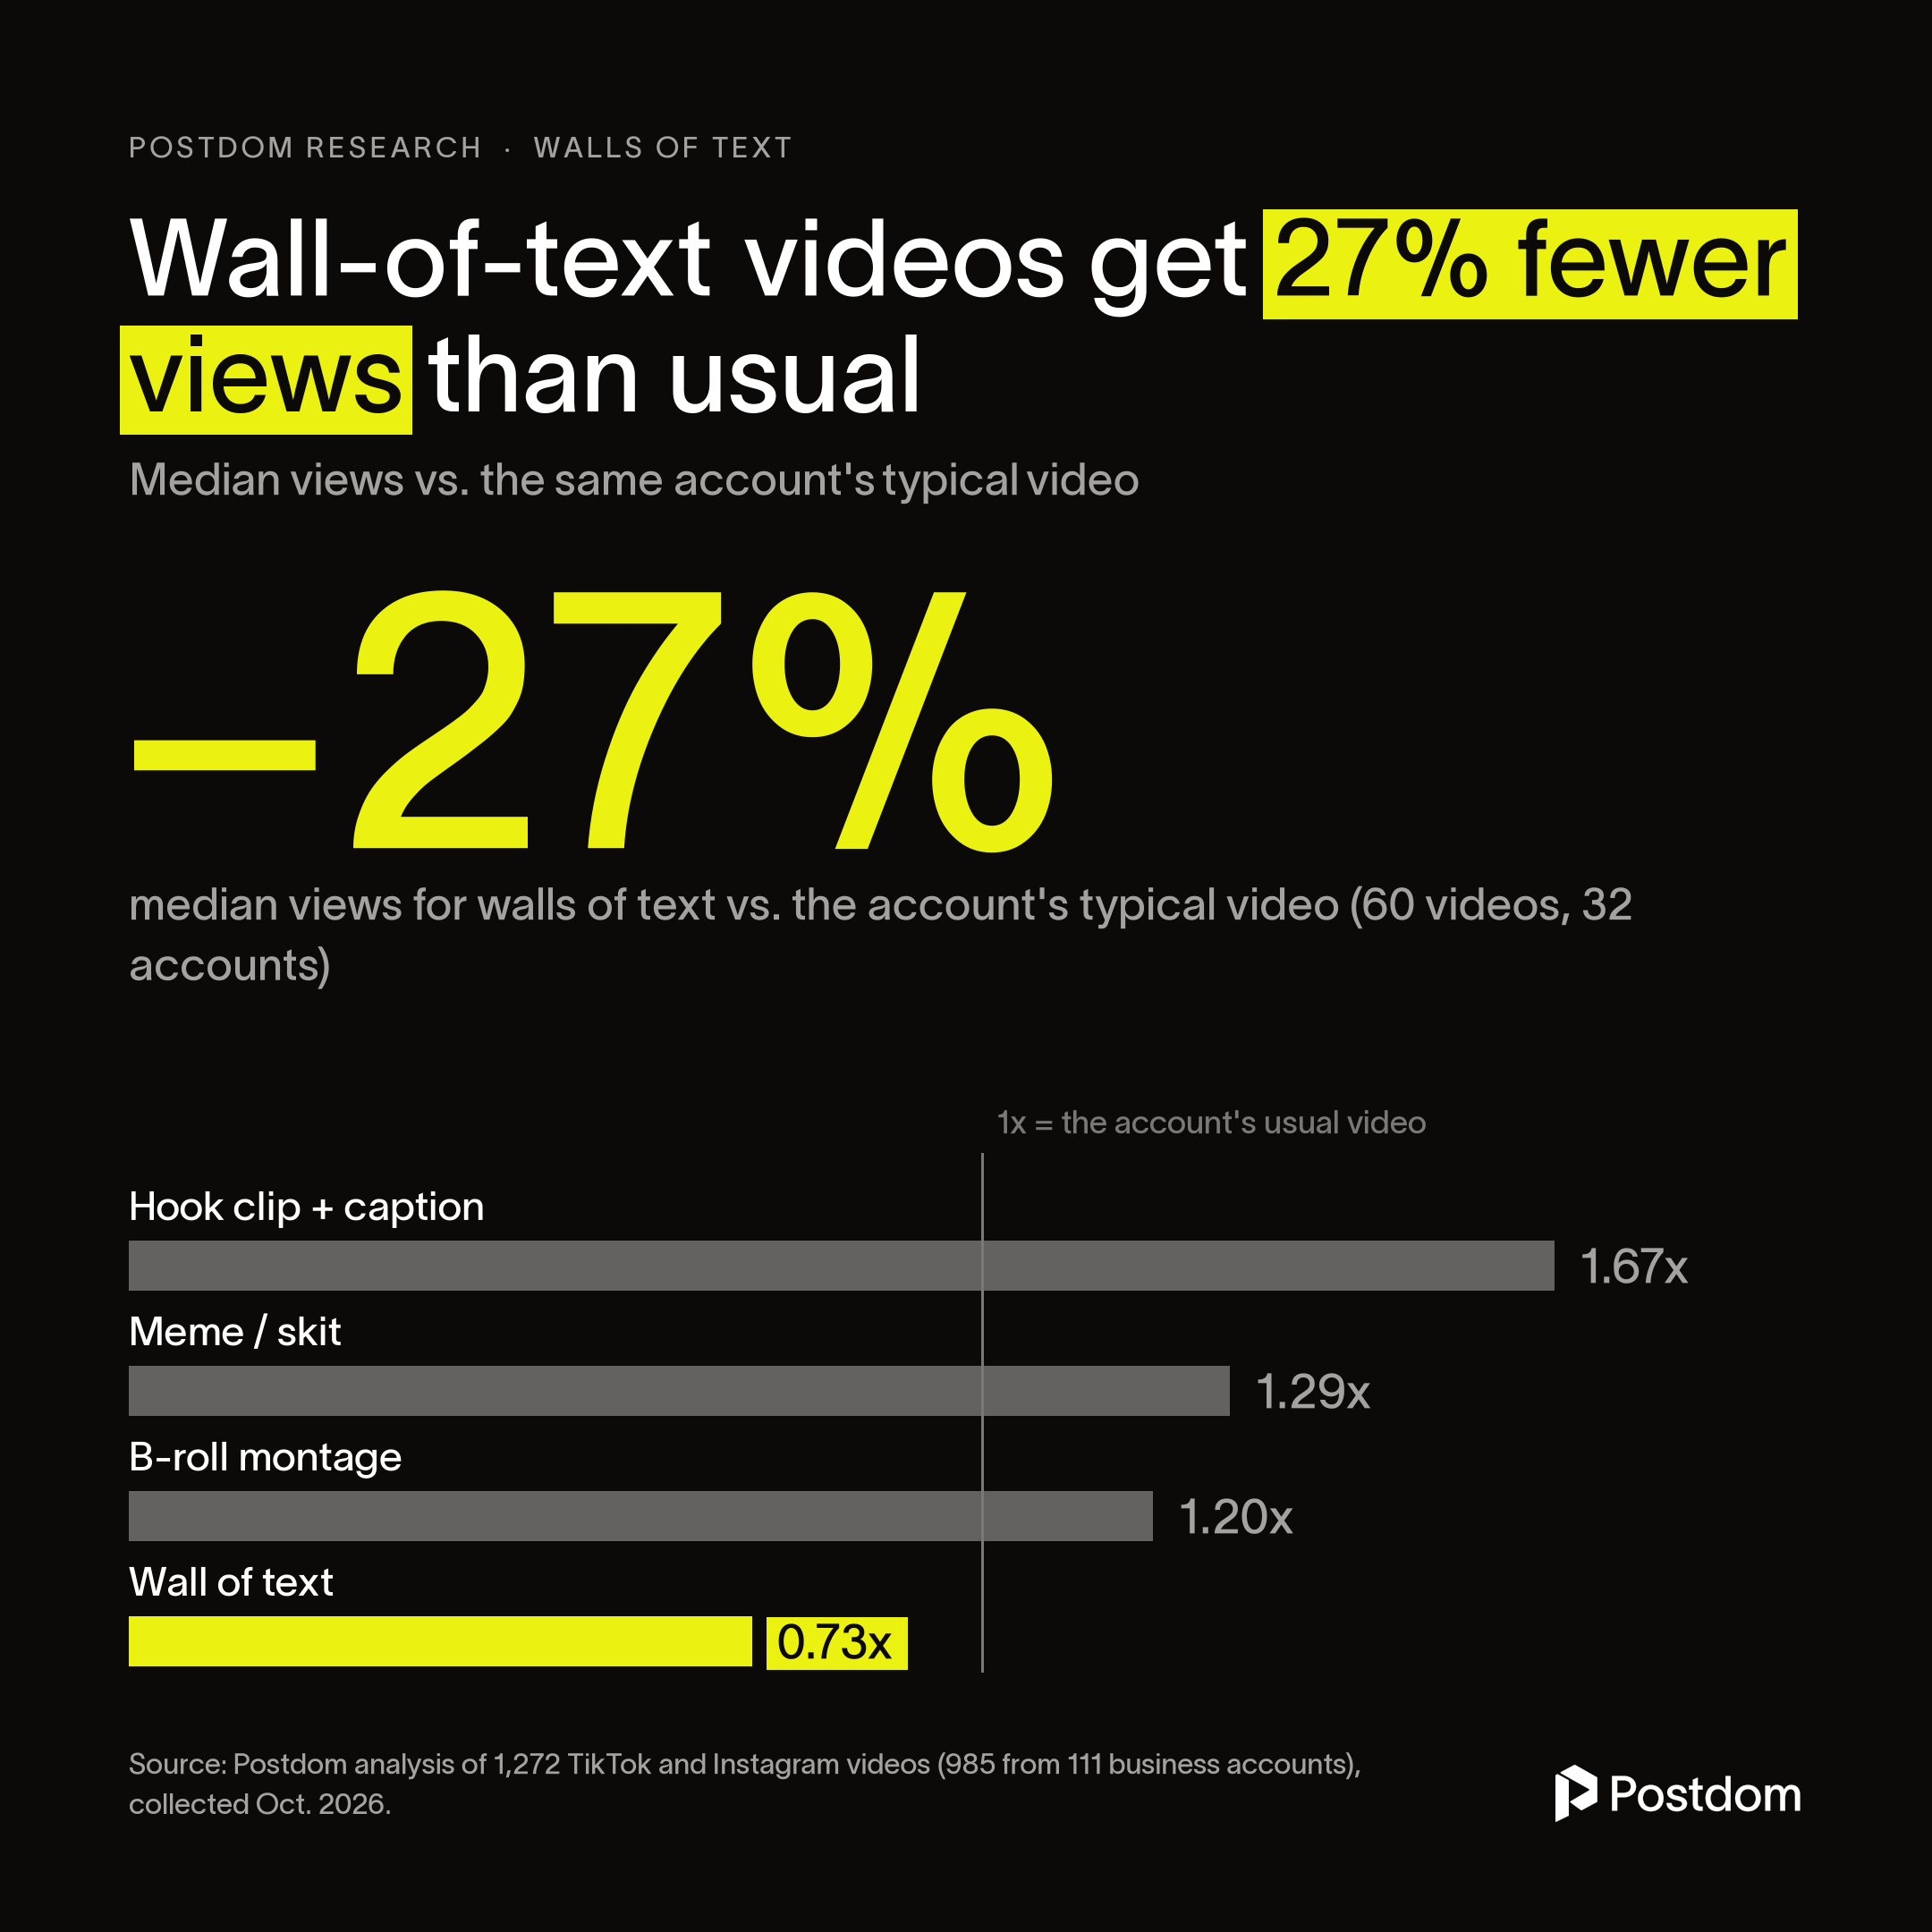
Median views relative to the account's typical video, business accounts. Source: Postdom analysis of 1,272 TikTok and Instagram videos, October 2026.
4 in 10: how often a wall of text beats its account's usual video
A median can hide a lot. So the analysis also counted how often each format beat the account's typical video.
Across all business videos, the answer is close to a coin flip, 50%. That's partly built into the sample (see Methodology). Walls of text managed it 40% of the time, 24 of 60. Memes did it 59% of the time and hook clips 57%.
That doesn't make the wall of text dead. Nearly a third of them (19 of 60) still doubled their account's usual views. It just loses more often than the alternatives.
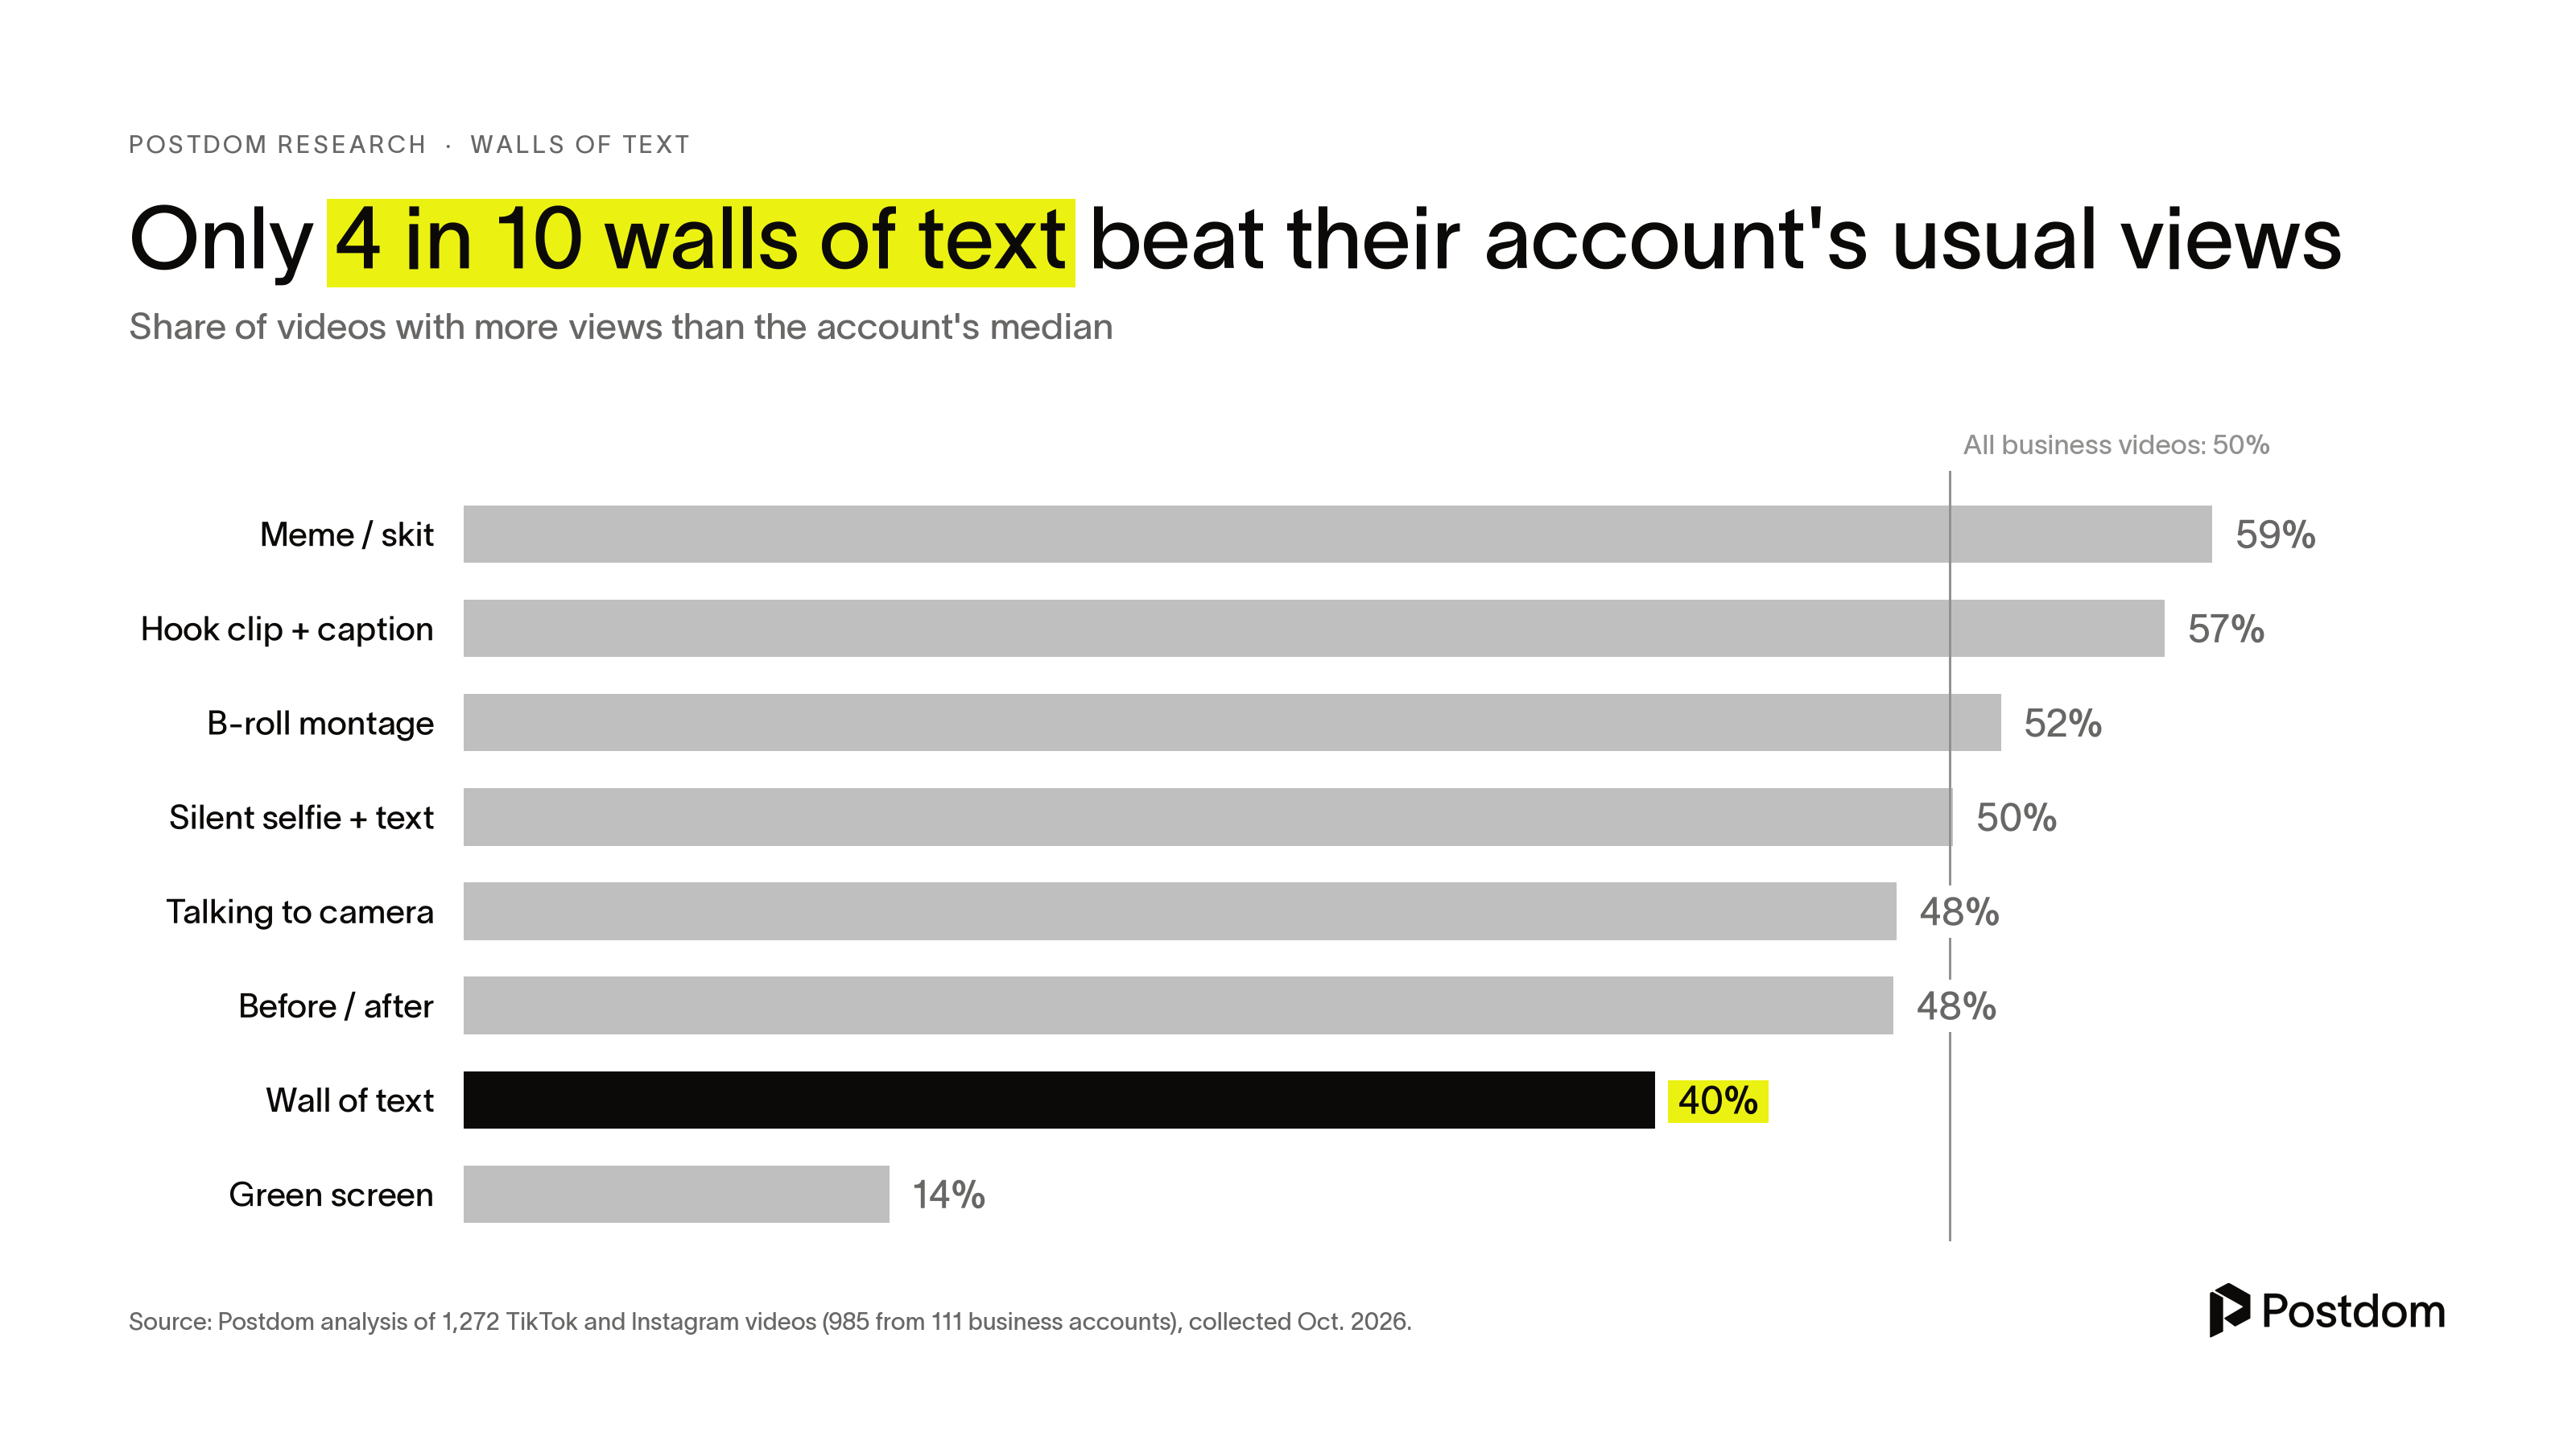
Share of videos with more views than the posting account's median. Source: Postdom analysis of 1,272 TikTok and Instagram videos, October 2026.
11 saves per 100 likes: the 'save it for later' defence falls flat
The usual case for a wall of text is that people bookmark it to read later. Mostly, they didn't.
Walls of text drew a median 11.1 saves per 100 likes, a bit under the 12 for all business videos. People talking to camera (14.3) and hook clips (13.9) were saved more often.
A wider cut of the data leans the same way. On TikTok, business videos with more than 40 words on screen got about a fifth fewer views (0.78x) than the same accounts' other videos. That gap isn't statistically firm, and on a much smaller Instagram sample it reversed.
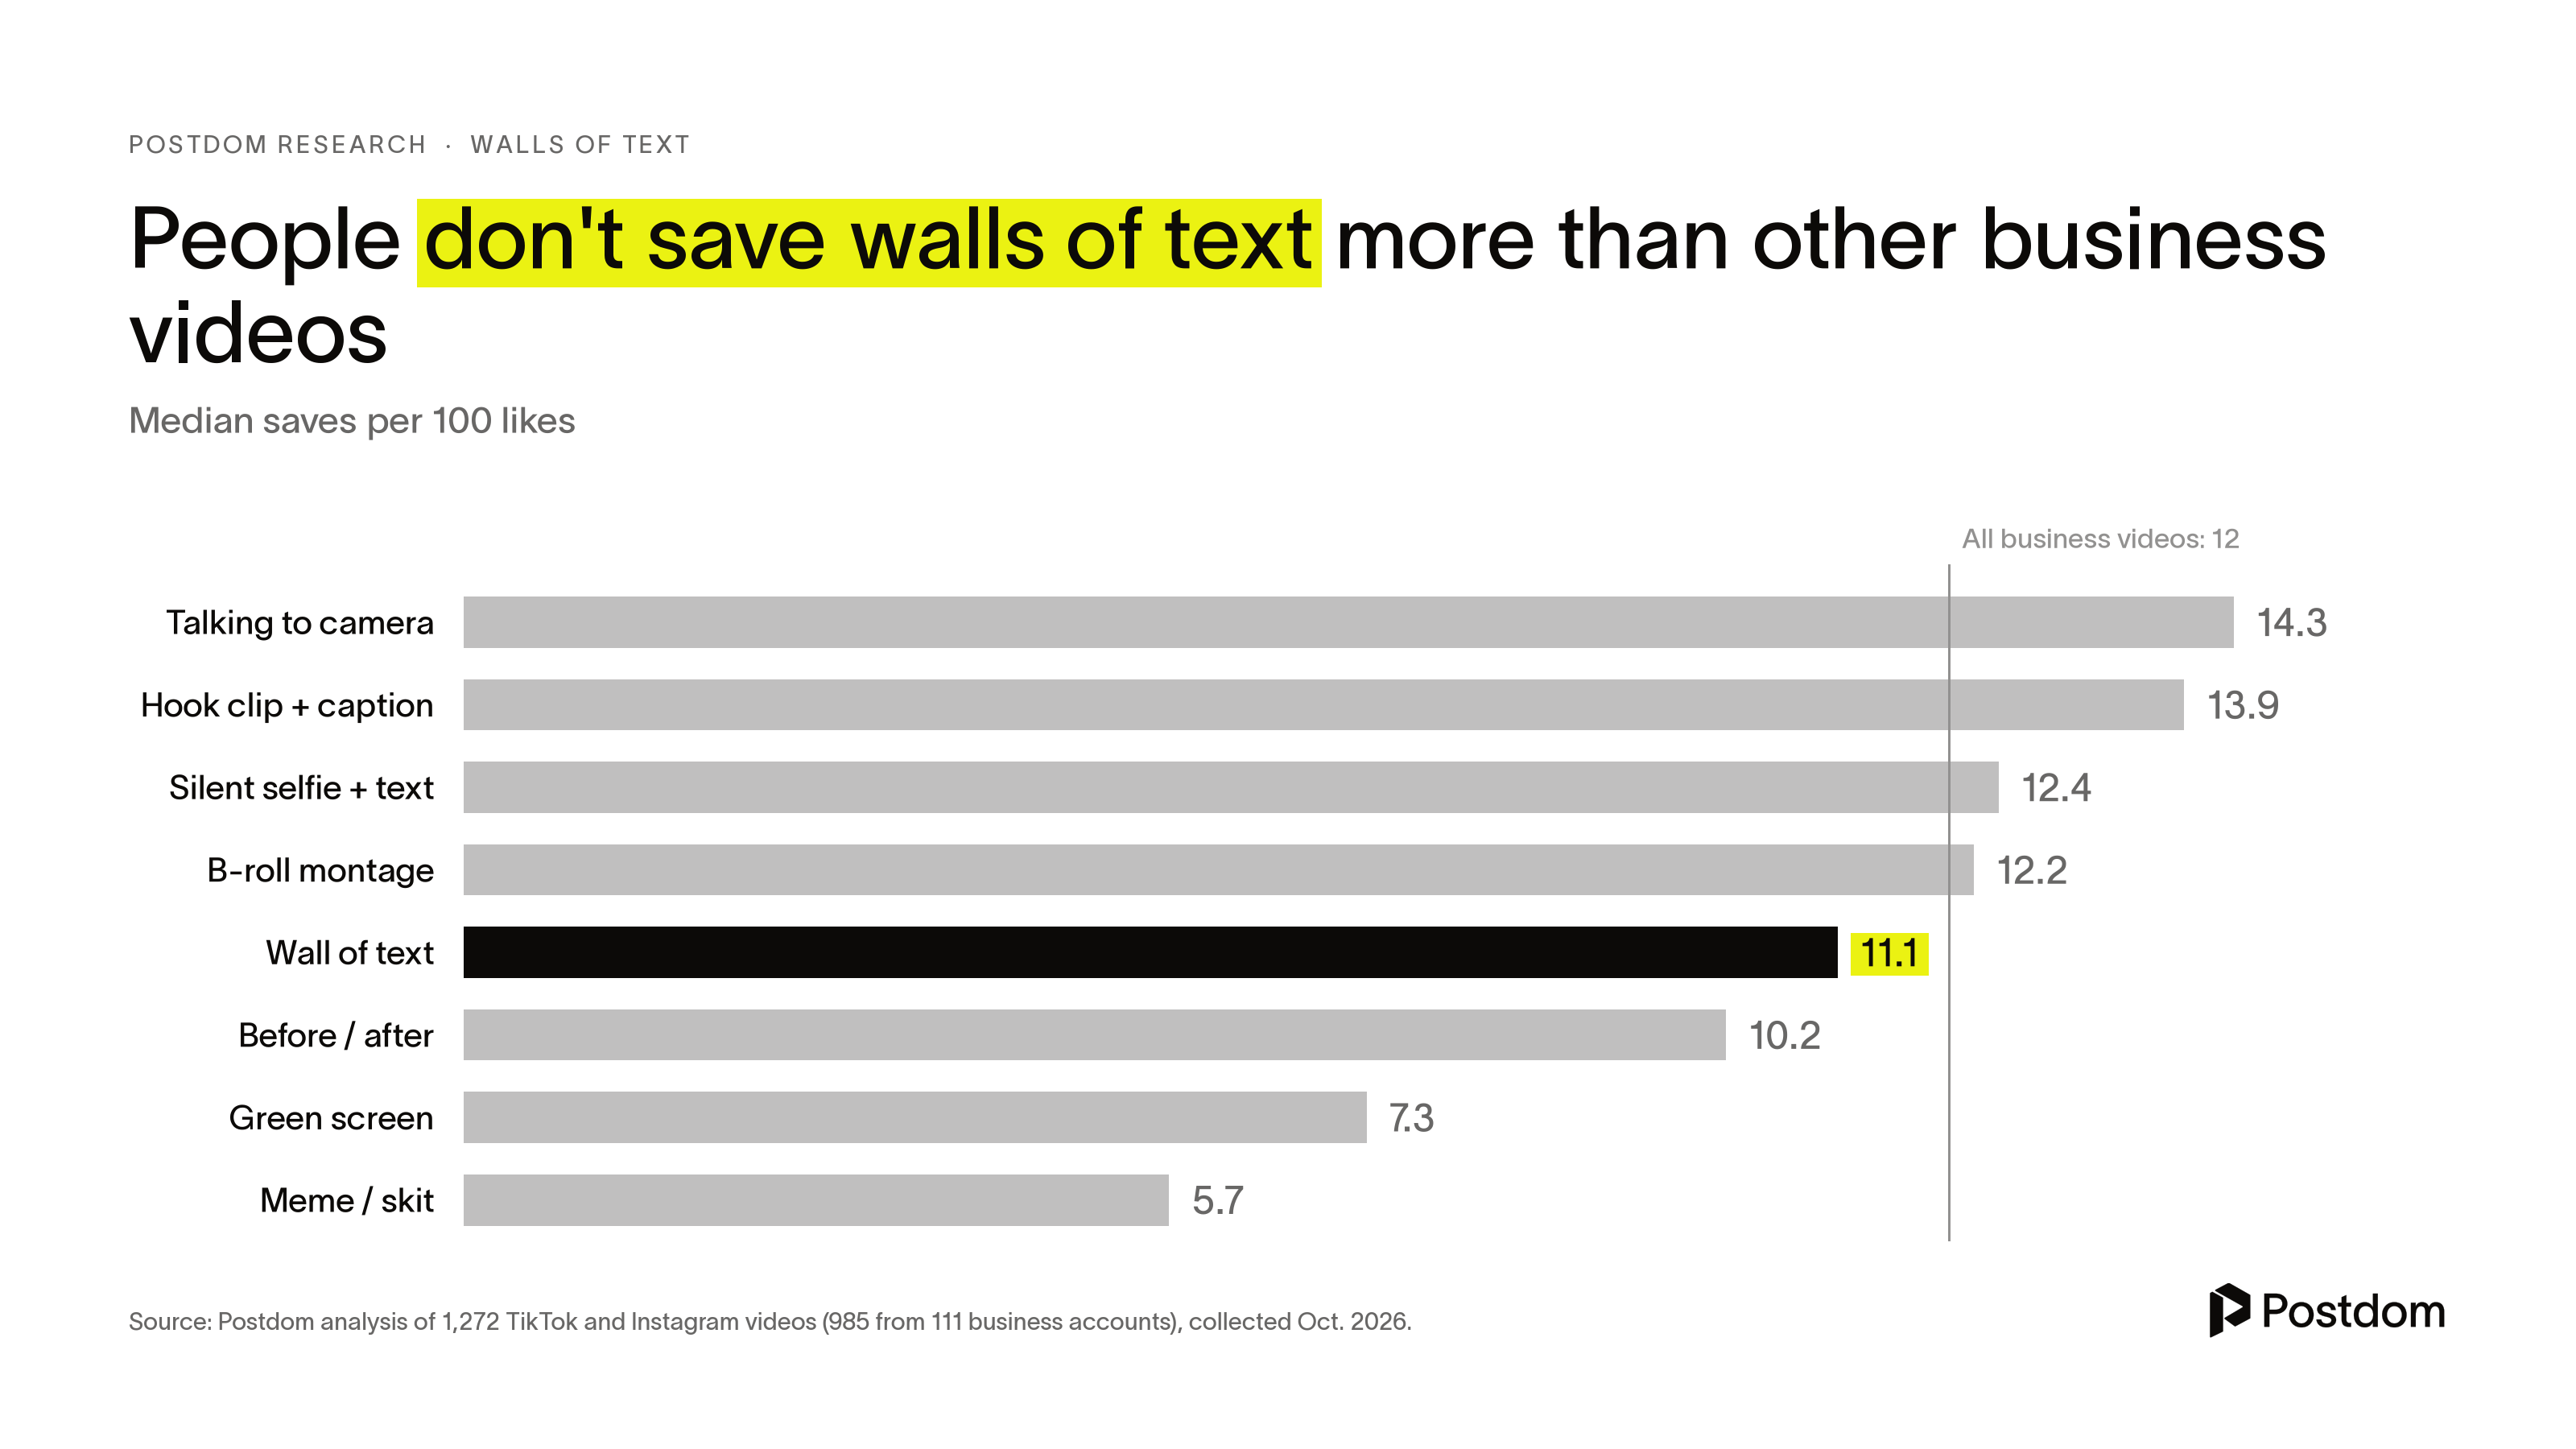
Median saves per 100 likes, business accounts. Source: Postdom analysis of 1,272 TikTok and Instagram videos, October 2026.
1.67x: one line on screen, the story in the caption
The top format in the sample is the opposite of a wall of text. A hook clip is a short real-life shot, about 10 seconds long, with a single line on screen. The detail lives in a long caption.
The 21 hook clips from 16 business accounts reached a median 1.67x. With so few videos the range of likely values is wide, so treat the exact figure with care.
The pattern shows up at the very top of TikTok, too. In a separate review of high-view posts, a product clip whose only on-screen text read "Please please read the caption" passed 15.8 million views and 47,500 comments.
5.7 saves per 100 likes: memes spread, but few people keep them
Reaction memes and skits, a relatable "POV" or "me when" line over a short clip, reached a median 1.29x across 46 business videos. They had the best hit rate of any format.
The catch is in the saves. Memes collected 5.7 saves per 100 likes, the lowest of any format and under half the business average. People share a joke and move on.
One clip can still travel far. A personal trainer's "POV: your trainer when the weight looks too easy" video reached 9 million views on TikTok.
18 million views: the montage that turns a list into shots
Montages of real footage, with a short text label and a music track, reached a median 1.20x across 31 business videos. They were saved at about the average rate.
The best ones are lists in disguise. Instead of stacking ten items in one block, each stop gets its own shot and its own label. One Italian road-trip reel built that way, with a "Stop 1, Stop 2" label per clip, passed 18 million views on Instagram.
Among the high-view list and itinerary montages Postdom reviewed, saves ran from 25% to 110% of likes. Those are top performers, not a random sample.
2 of 14: green-screen explainers did worst of all
Green-screen explainers, where a presenter stands in front of a screenshot or slide, scored lowest. The 14 videos from 12 business accounts reached a median 0.53x. Only 2 of the 14 beat their account's typical video.
It's the only format whose 95% confidence range sits entirely below the account's usual views.
Green screens can break out when they react to news. In the high-view review, six of the nine green-screen hits reacted to news or a viral clip. One was a lawyer's "real lawyer reacts" video at 9.5 million views.
0.63x: shorter walls did no better
Cutting the wall down looks like the obvious fix. The numbers didn't back it. Walls of 15 seconds or less reached 0.63x, against 0.73x for longer ones.
Some walls did break out, and they opened with one short, specific line. A real-estate video, "14 Things to Avoid Before Buying a House," passed 2.2 million views on TikTok. A remote-work reel showed only its hook for the first seconds before a list replaced it. It drew 174,000 views, against 3,000 to 40,000 for that account's other reels.
Those are single examples. Only 3 of the 60 walls in the dataset opened that way, too few to test.
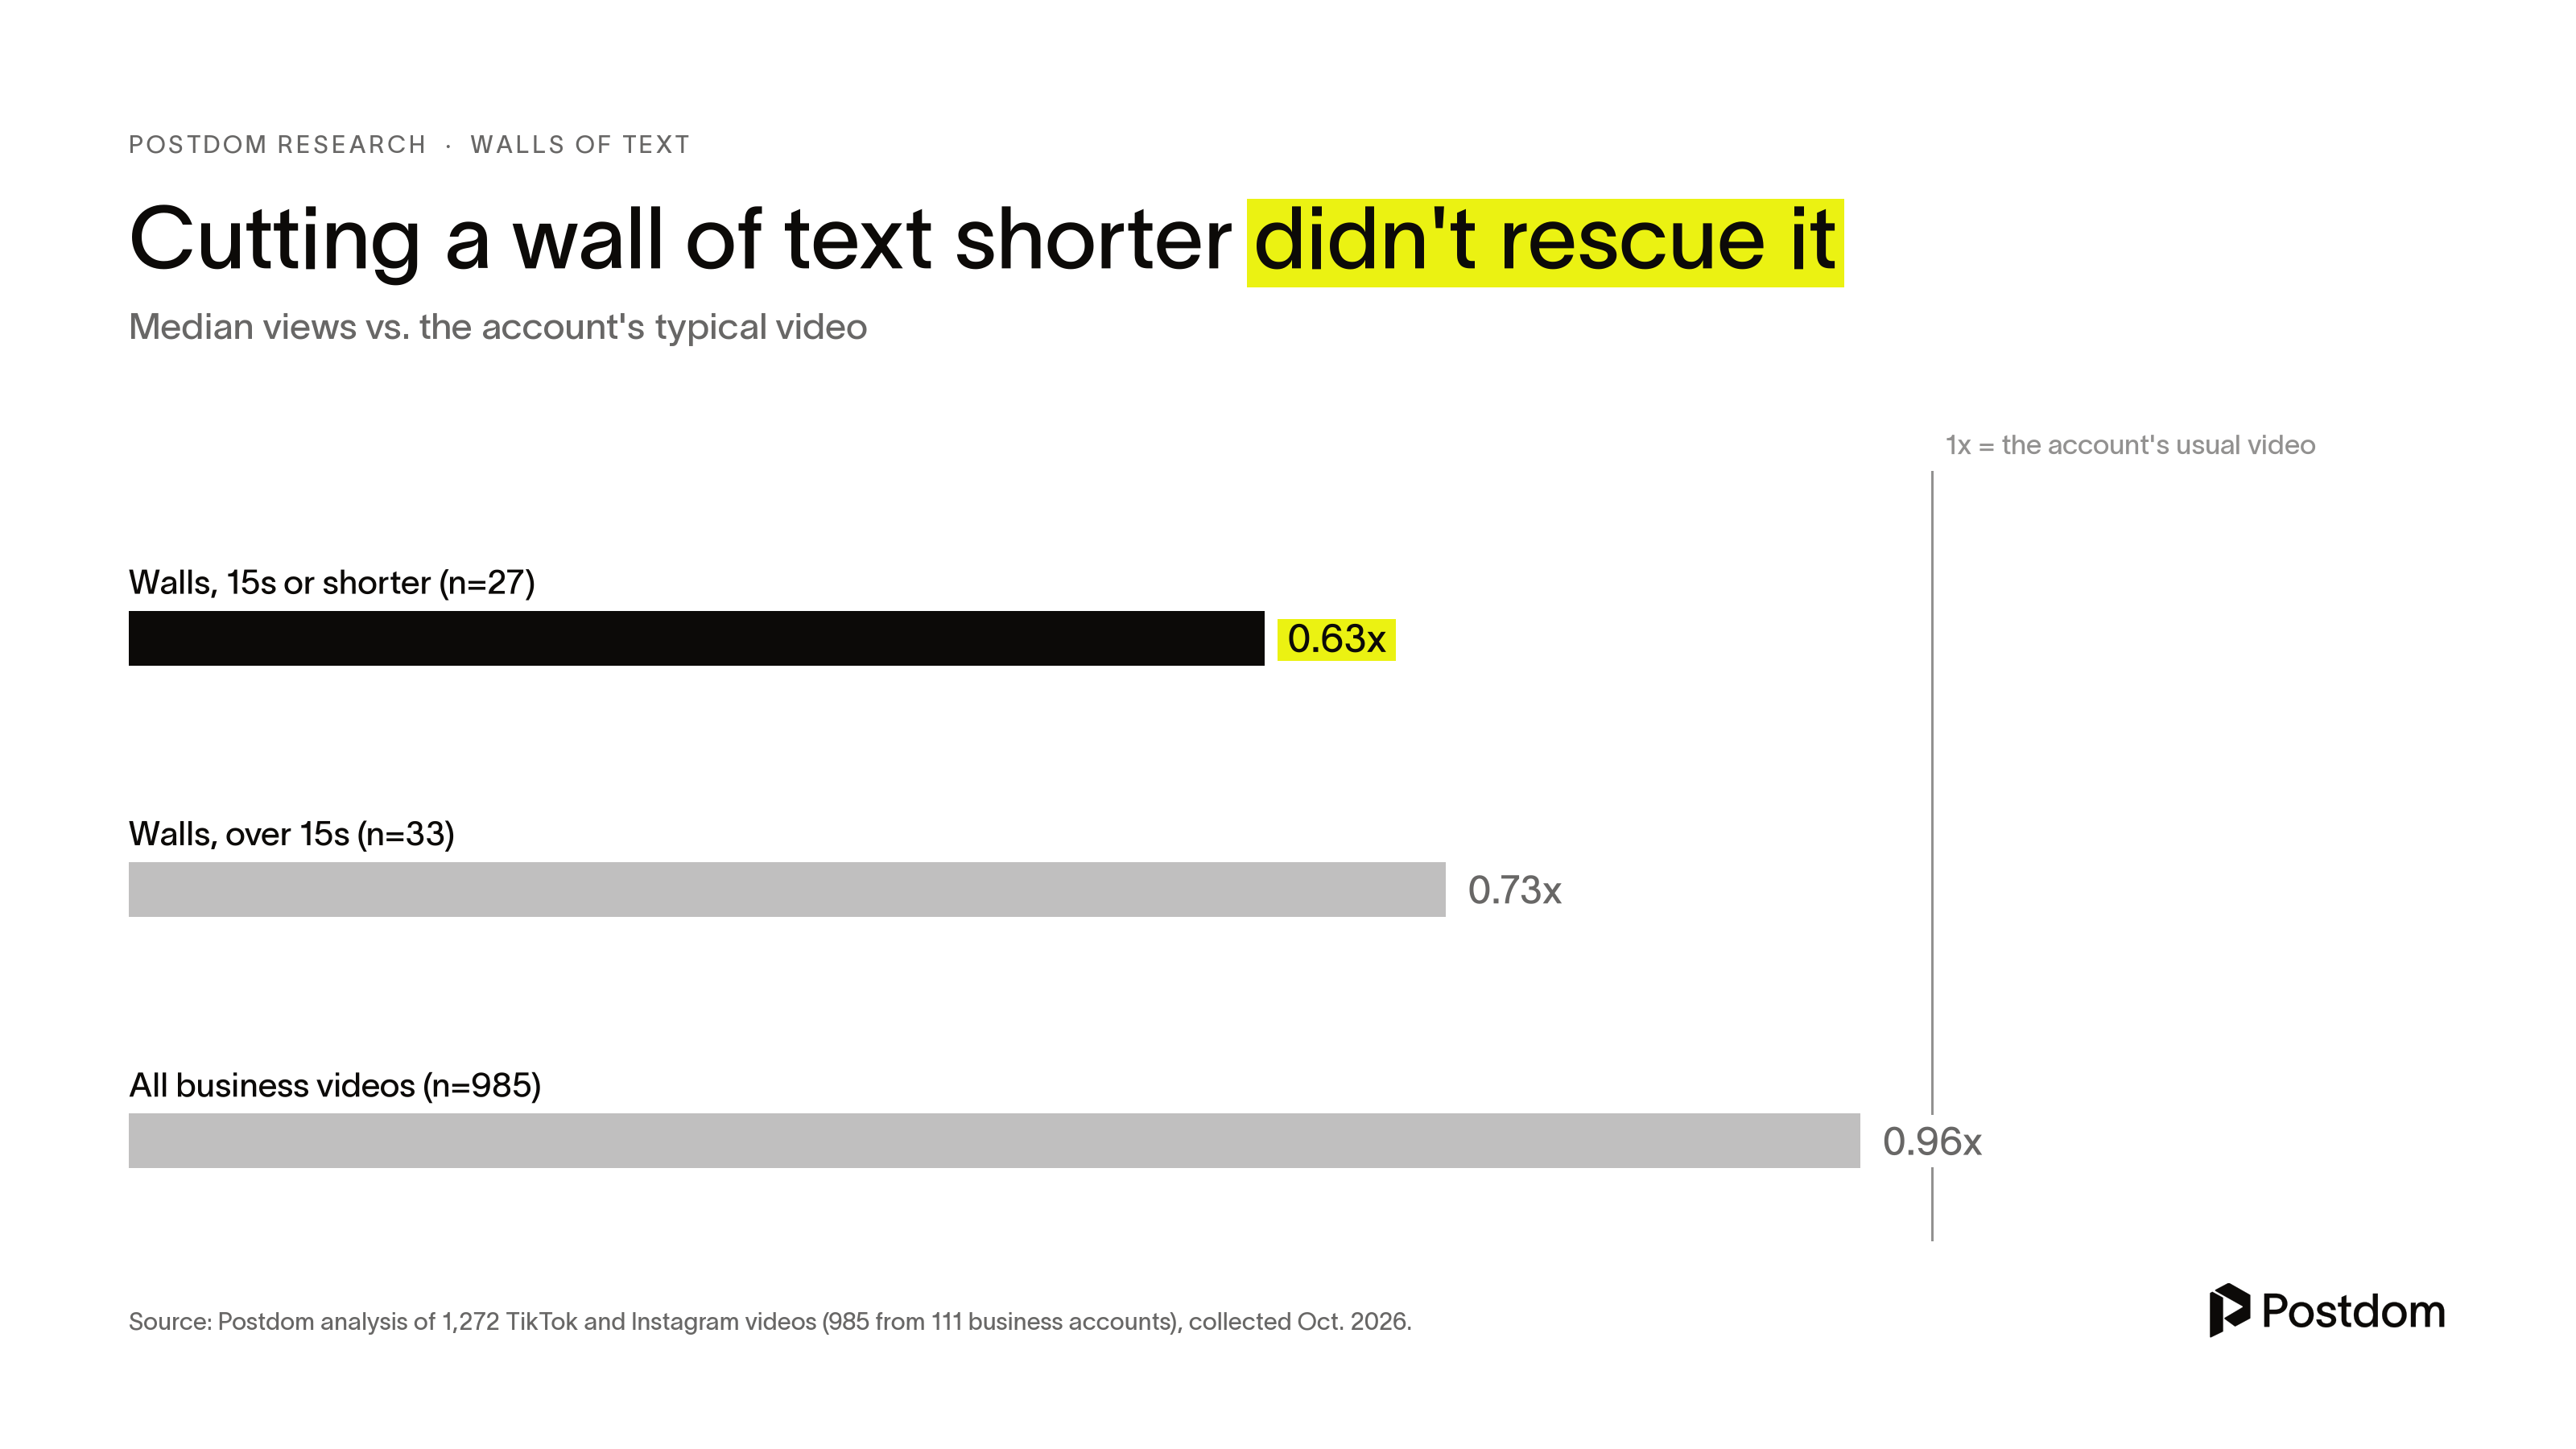
Median views relative to the account's typical video. Source: Postdom analysis of 1,272 TikTok and Instagram videos, October 2026.
1 in 7 brand videos: who posts walls of text
Consumer brands lean on the format most. Walls of text made up 35 of 253 consumer-brand business videos in the sample, about 1 in 7.
Local service pros, such as realtors, dentists, lawyers and salon owners, almost never used it. Just 4 of their 223 videos were walls of text, under 2%. About 7 in 10 of their videos (158 of 223) showed them talking to camera.
For scale, Pew Research Center found that 37% of U.S. adults use TikTok and half use Instagram, in a survey run from February to June 2025.
5 swaps to try instead of a wall of text
Put one line on screen. Move the detail into the caption, and say so: "read the caption."
Give every list item its own shot. A montage with one label per clip carries the same information and scored higher.
Use memes for reach, not for reference content. They spread, but few people keep them.
Keep green screen for news. React to something that happened this week, not to a slide.
If you keep the wall, lead with the hook alone, then bring in the list. Check length and on-screen text against each platform's limits first, for example with Postdom's free video spec checker (postdom.com/tools/video-spec-checker). The full method and data are on Postdom's research page (postdom.com/research/types-of-tiktok-videos).
Methodology
Data: 1,272 public short videos (1,120 TikTok, 152 Instagram) from accounts in four niches: local professional services, relocation and immigration, consumer brands, and software apps. Collected in early October 2026. 985 videos came from 111 business accounts (business owners posting as themselves, brand UGC and official brand accounts). Another 287 creator videos were excluded from the main figures. Only 3 of the 60 business walls of text came from Instagram, so the wall-of-text finding is essentially a TikTok finding.
Sampling: accounts with at least 10 eligible videos (non-ad, at least 7 days old, 3 minutes or shorter) were drawn at random within each niche. For each account Postdom took the median views of all its eligible videos, then sampled eight: its three most-viewed, its three least-viewed and two from the middle. That design means about half of all sampled videos sit above their account's median, so the comparison asks which formats turn up among an account's hits and which among its misses. Format shares by niche describe this sample, not all posting.
Measure: each video's views divided by its account's median views. The format score is the median of that ratio. The "27% fewer views" figure restates the 0.73x median for walls of text. The "beat the median" share counts videos with a ratio above 1.0.
Formats were assigned from labels a vision model made on eight frames per video (shot type, text style, talking, cuts, on-screen words), plus caption length. Wall of text: music only or near-silent, little talking, 40 or more on-screen words, four or fewer distinct text frames. Green screen: a person over a screen recording or graphic for at least a quarter of frames. Hook clip: 20 seconds or less, little talking, a caption of 400 or more characters. Meme or skit: humorous or POV content, 20 seconds or less, little speech. Montage: music only, mostly b-roll, three or more cuts, text on most frames. Formats can overlap.
Uncertainty: 95% intervals come from a bootstrap that resamples accounts, not videos (4,000 draws). Most intervals are wide and overlap. Only green screen sits wholly below 1.0x. The ranking is directional and shows correlation, not causation. Accounts that choose a format may differ in other ways.
Examples quoted with view counts come from a separate review of 74 high-view TikTok posts and 80 saved Instagram posts, read in October 2026. They are top-of-niche winners chosen for illustration, not a sample. Creator accounts are not named. A proxy for the hook-first wall (a short hook alone, then the list) matched only 3 of 60 walls in the dataset (median 0.48x), too few to test.
The 0.78x text-volume figure is a within-account comparison across 840 TikTok business videos from 105 accounts (geometric mean, 95% interval 0.57x to 1.08x). On Instagram (152 videos, 20 accounts, all account types) the same split came out at 1.21x (0.67x to 2.26x).
Sources
- Postdom research page: full method, charts and data summary: https://postdom.com/research/types-of-tiktok-videos
- Pew Research Center, Americans' Social Media Use 2025 (survey Feb. 5 to June 18, 2025): https://www.pewresearch.org/internet/2025/11/20/americans-social-media-use-2025/
- Postdom video spec checker: https://postdom.com/tools/video-spec-checker
Related
All posts