
Research
What Works on TikTok by Industry: Faceless Videos Get Under Half the Views

Dentists and trainers did best with numbered lists. Immigration lawyers did best with stories. A study of 2,138 TikTok posts finds the winning format depends on what a business sells.

On this page
Postdom Research | TikTok by industry, October 2026
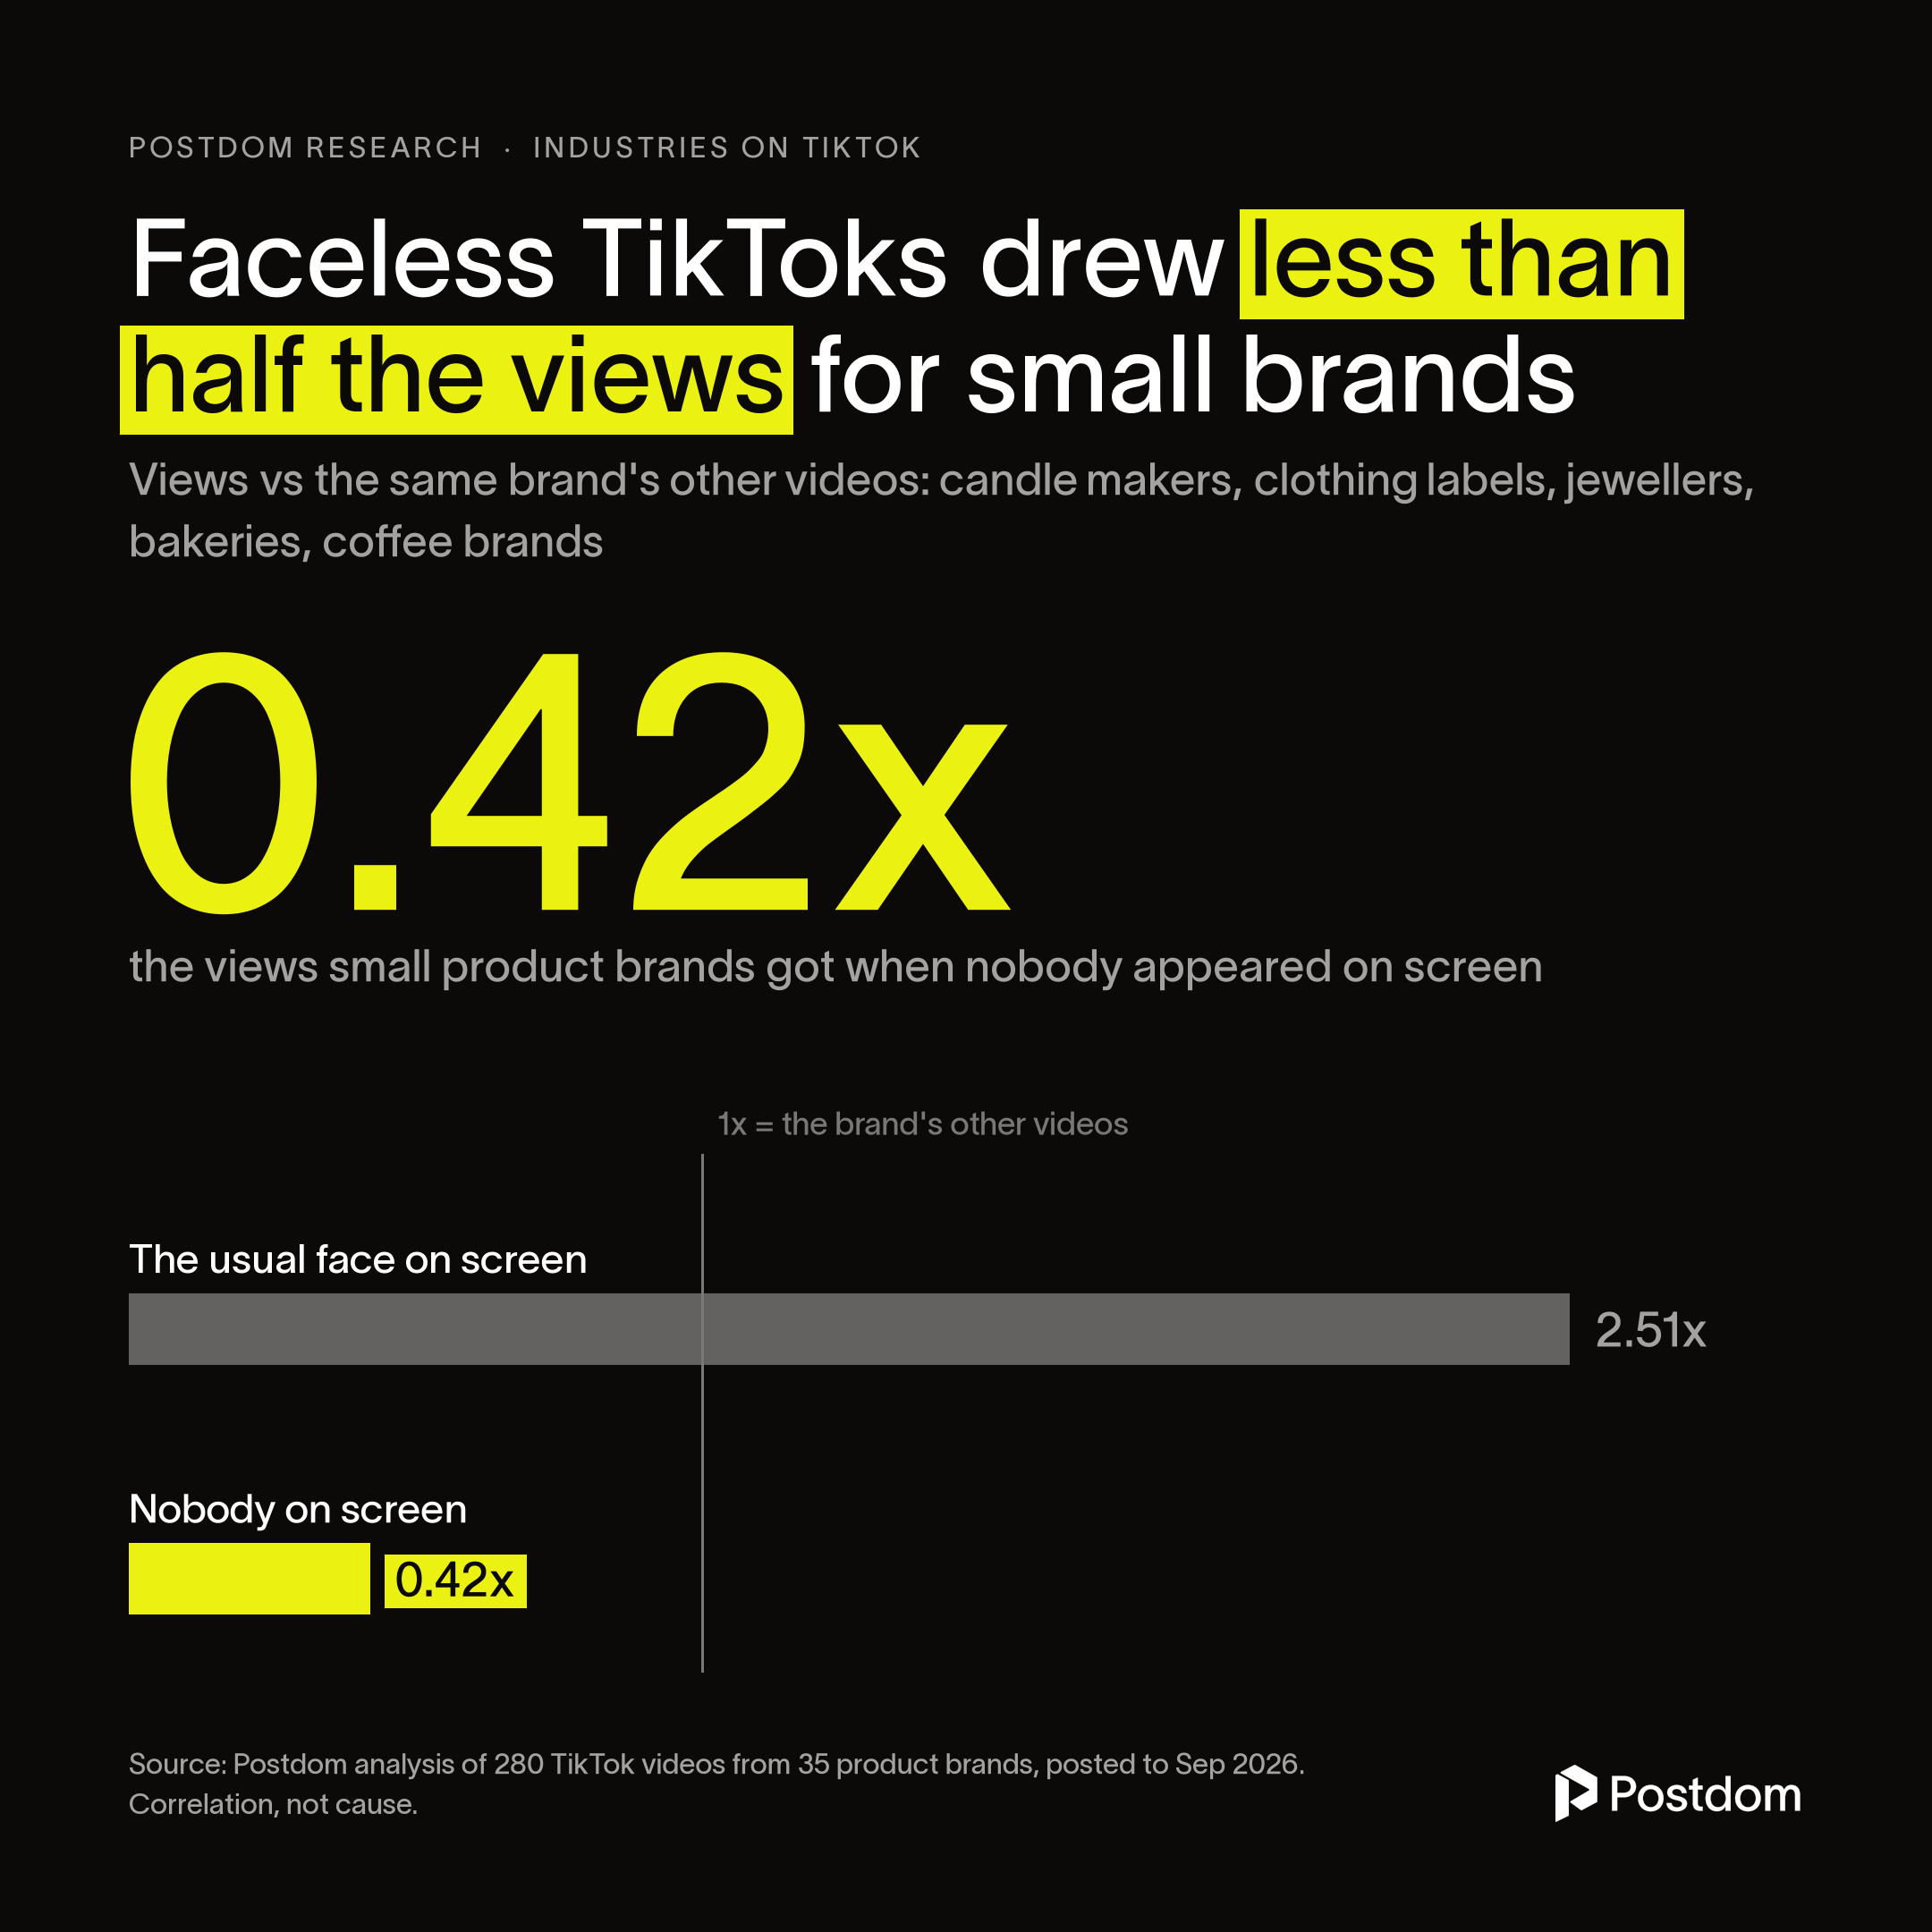
On TikTok, small brands that leave people out of the frame get far fewer views. Videos from candle makers, clothing labels and other product brands drew less than half the views of the same brands' other videos when nobody appeared on screen, according to an analysis by Postdom.
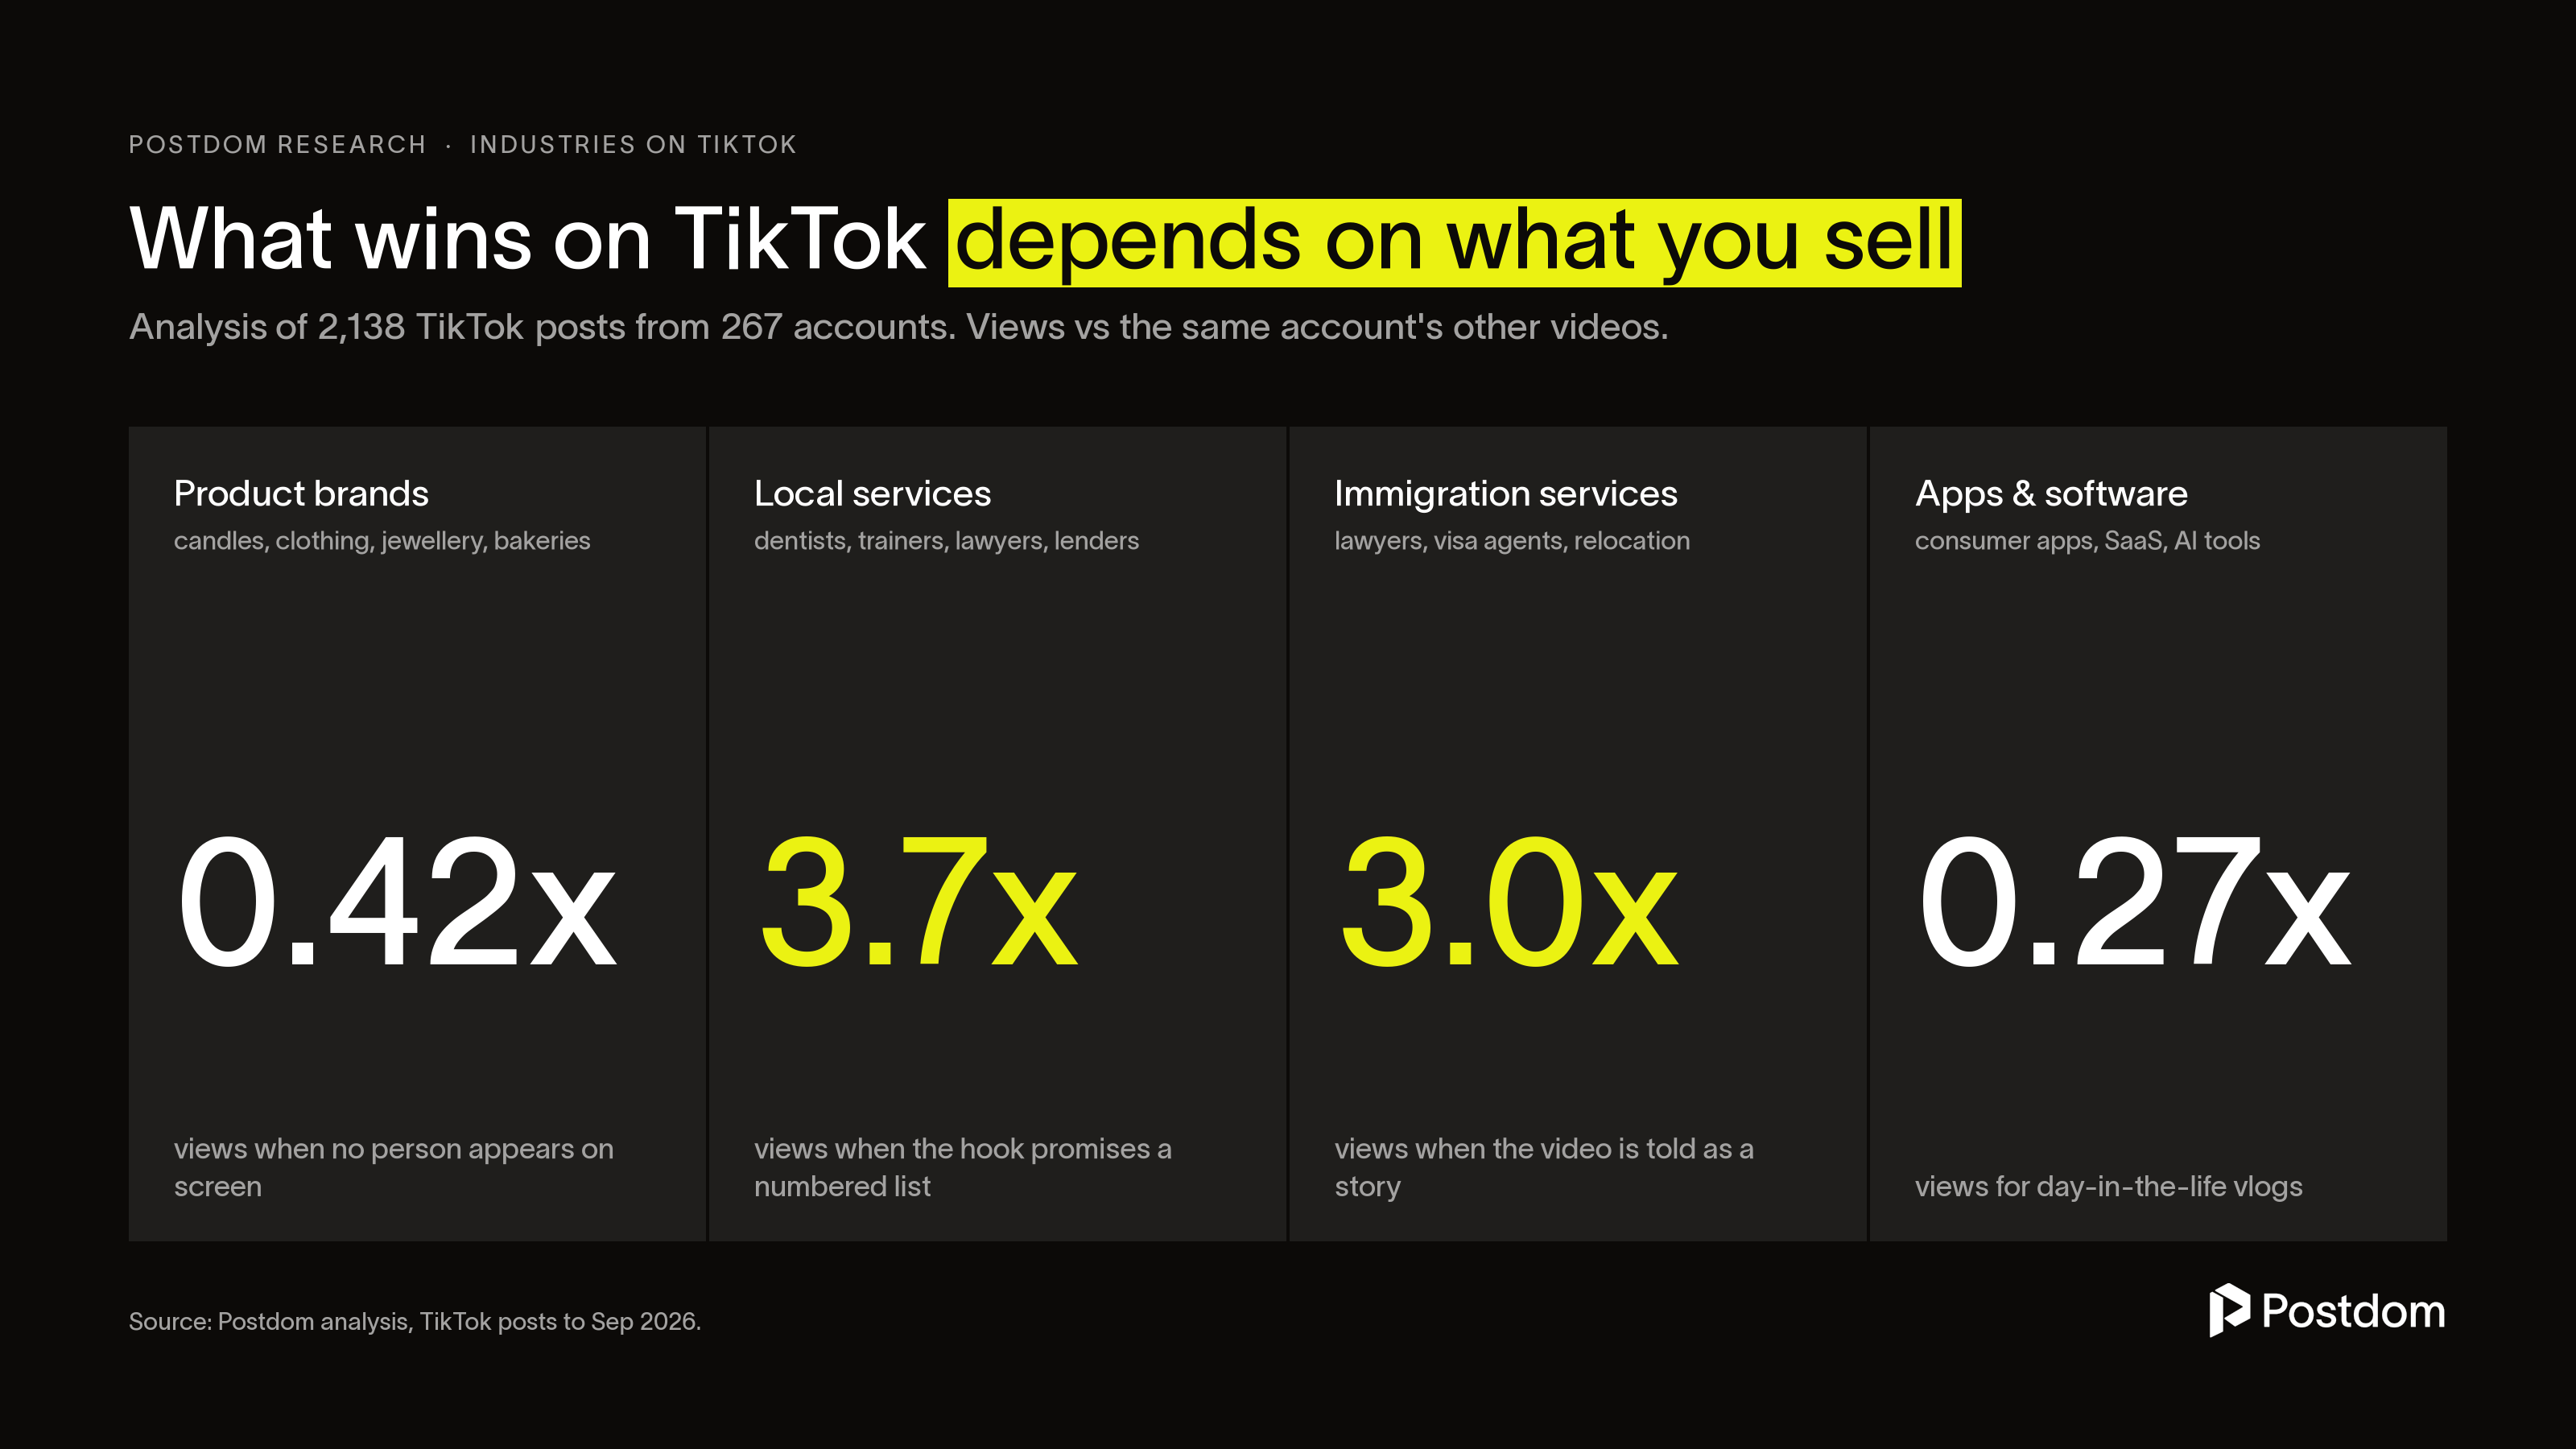
The winning format changed from one industry to the next. Dentists and trainers did best with numbered lists, immigration lawyers with stories. App makers' day-in-the-life vlogs drew about a quarter of their usual views.
Each post was compared with the same account's other posts. So a small bakery is measured against itself, not against a celebrity chef. The results show links between format and views, not proof that one causes the other.
Key findings: TikTok by industry
- Product brands: videos with nobody on screen drew 0.42 times the views of the same brands' other videos. Videos with the usual face drew 2.5 times.
- Dentists, trainers, lawyers and lenders: hooks that promised a numbered list drew 3.7 times the views.
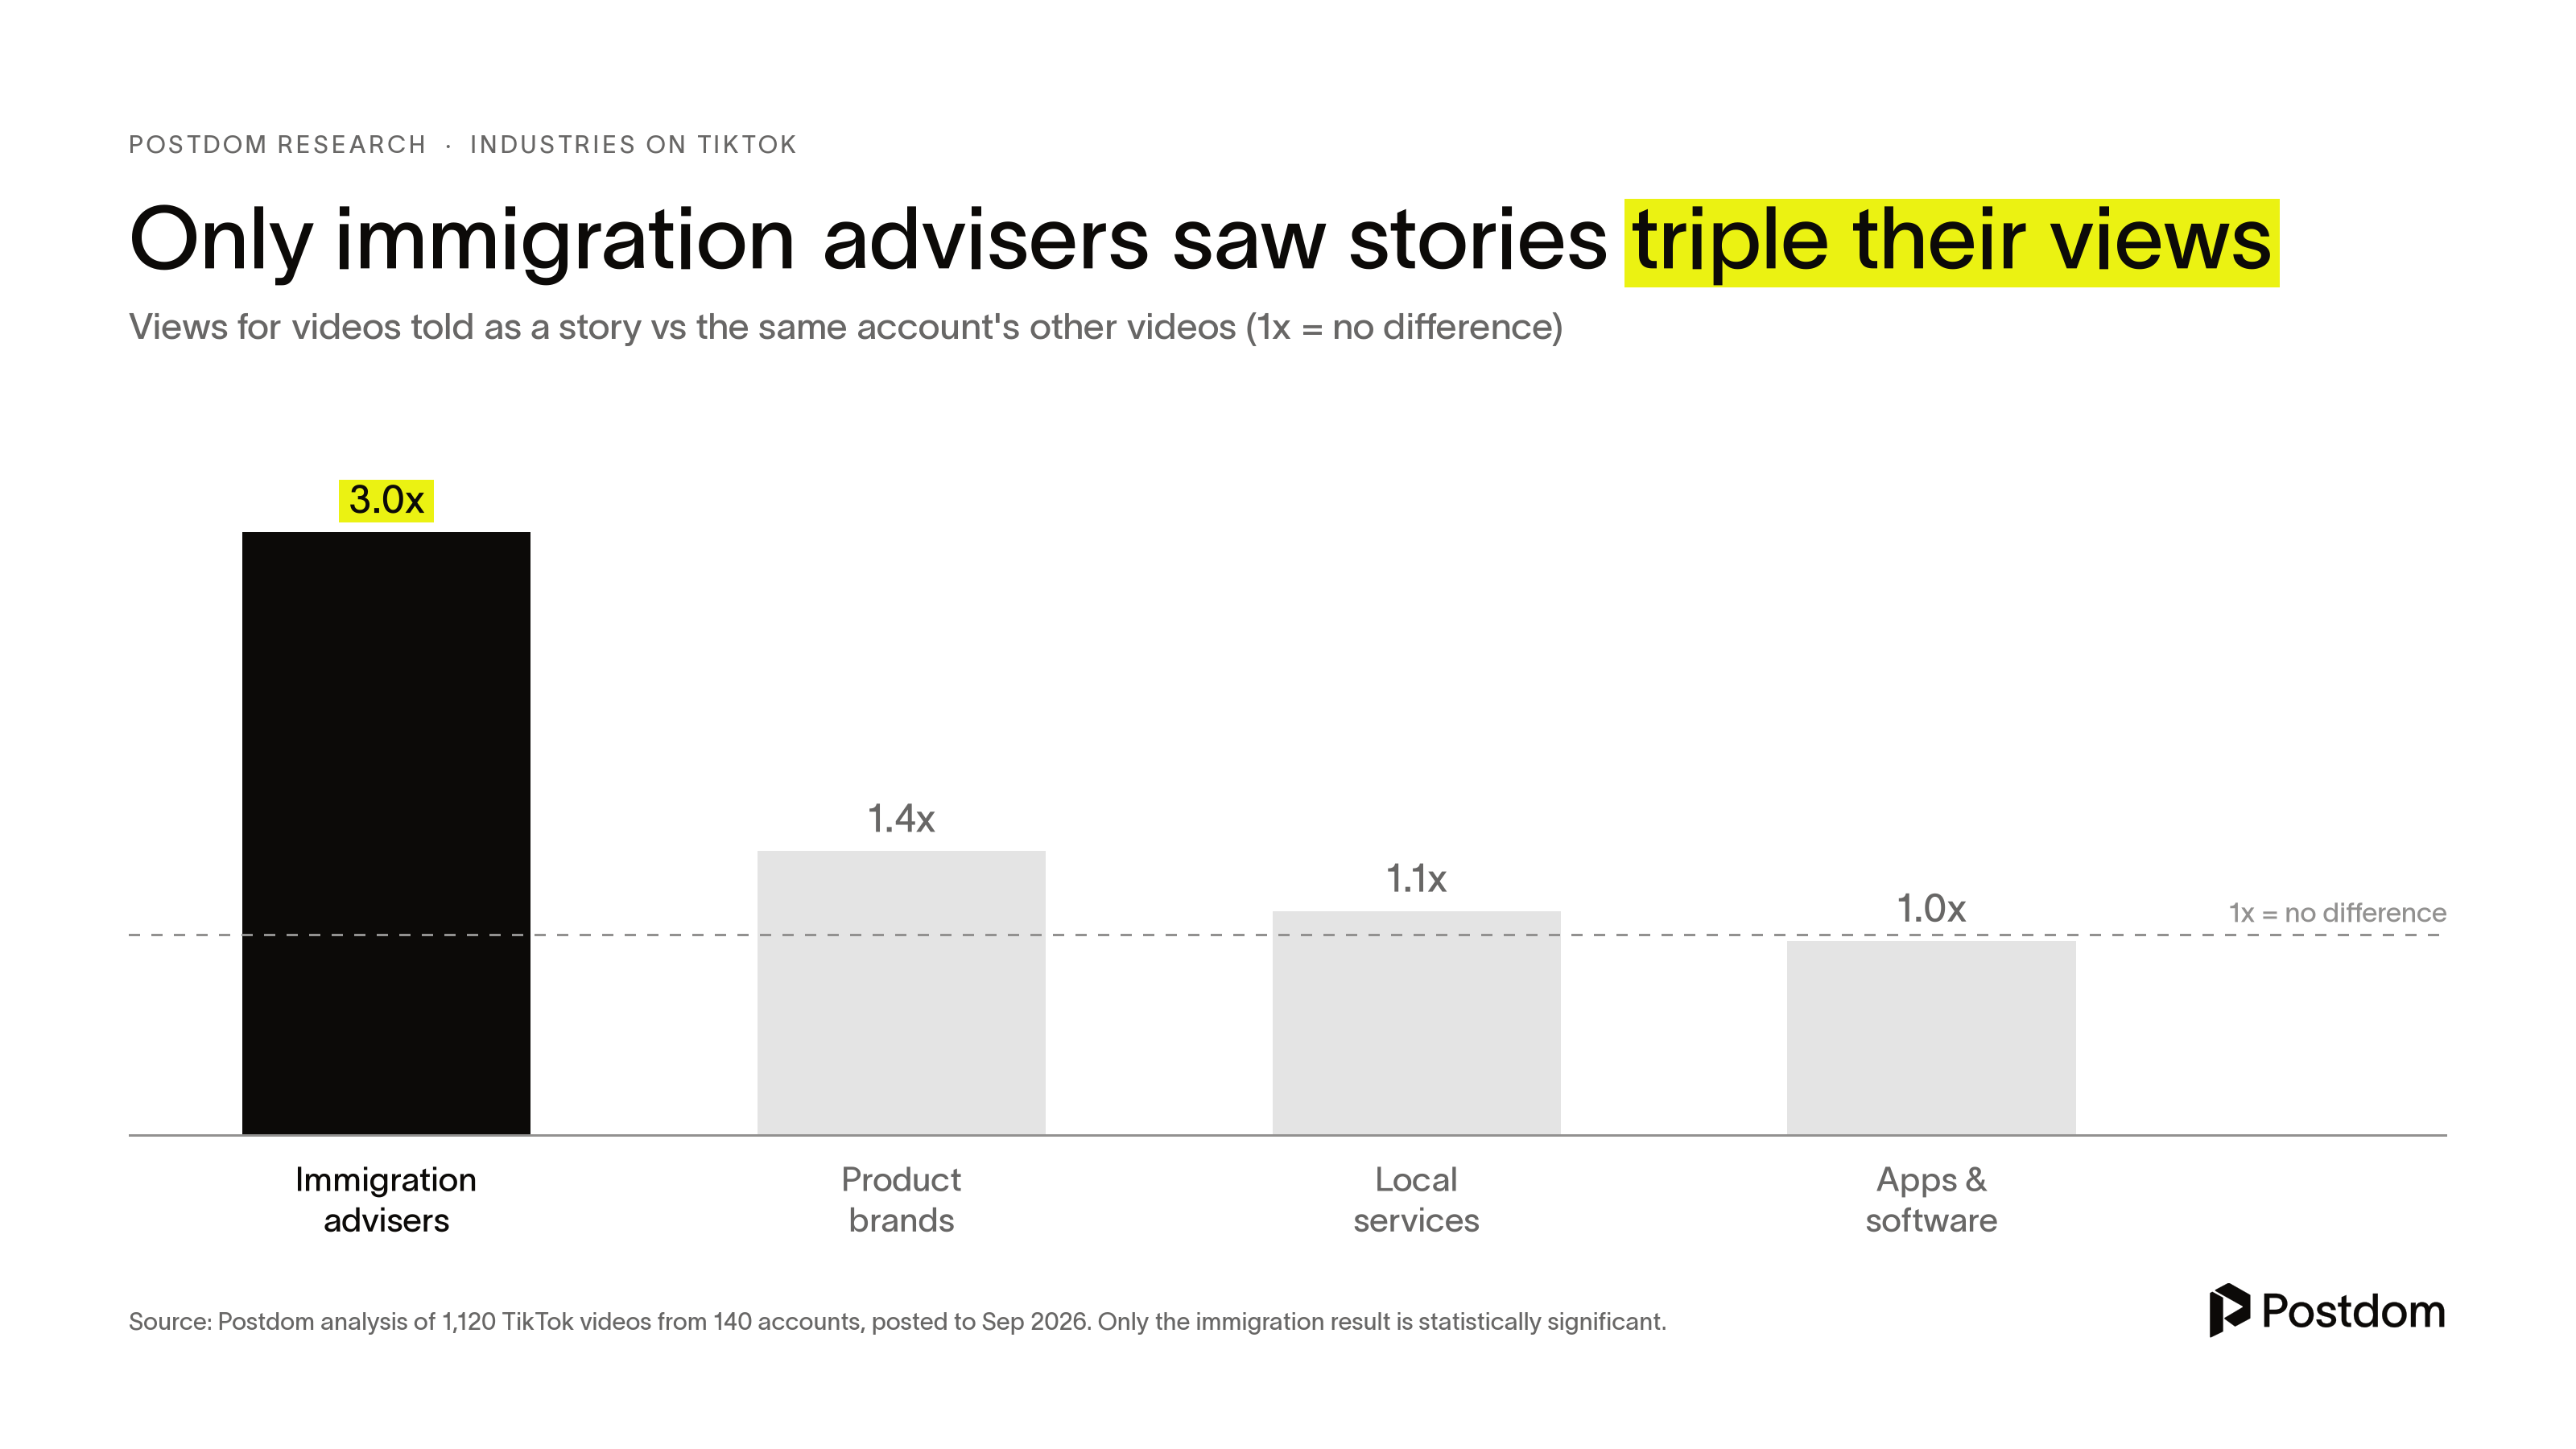
- Immigration lawyers and visa agents: videos told as a story drew 3 times the views.
- App makers: day-in-the-life vlogs drew 0.27 times the views.
- Across all 1,120 videos, a hook written on screen drew 1.89 times the views.
Product brands: videos with nobody on screen drew 0.42 times the views
Candle makers, clothing labels, jewellers, bakeries and coffee brands made up this group: 280 videos from 35 accounts. Videos with no person in them drew 0.42 times the views of the same brands' other videos. Videos starring the account's usual face drew 2.5 times.
“When nobody appeared on screen, small product brands drew less than half their usual views.”
Opening on a real place, such as a shop floor or a street, went with 2.6 times the views. Clips built on a single moment did worst, at 0.34 times. Videos under 20 seconds drew 0.46 times.
One candle maker opened a video with "I'm a 34 year old small business owner and I'm not afraid to admit..." It drew 89 times the account's typical views. In a small sample of 11 videos, hooks where the speaker named their role drew 3.5 times the views.
Local service pros: numbered-list hooks drew 3.7 times the views
Dentists, physical therapists, trainers, lawyers and lenders posted 256 of the videos, from 32 accounts. Hooks that promised a count, such as "5 best exercises", drew 3.7 times the views of the same accounts' other videos. Hooks that teased something the video later revealed drew 2.35 times.
A personal trainer's "5 best exercises to gain muscle in your arms by January" reached about 103,000 views. That is 52 times her typical video. Her pregnancy vlogs drew about half her usual views.
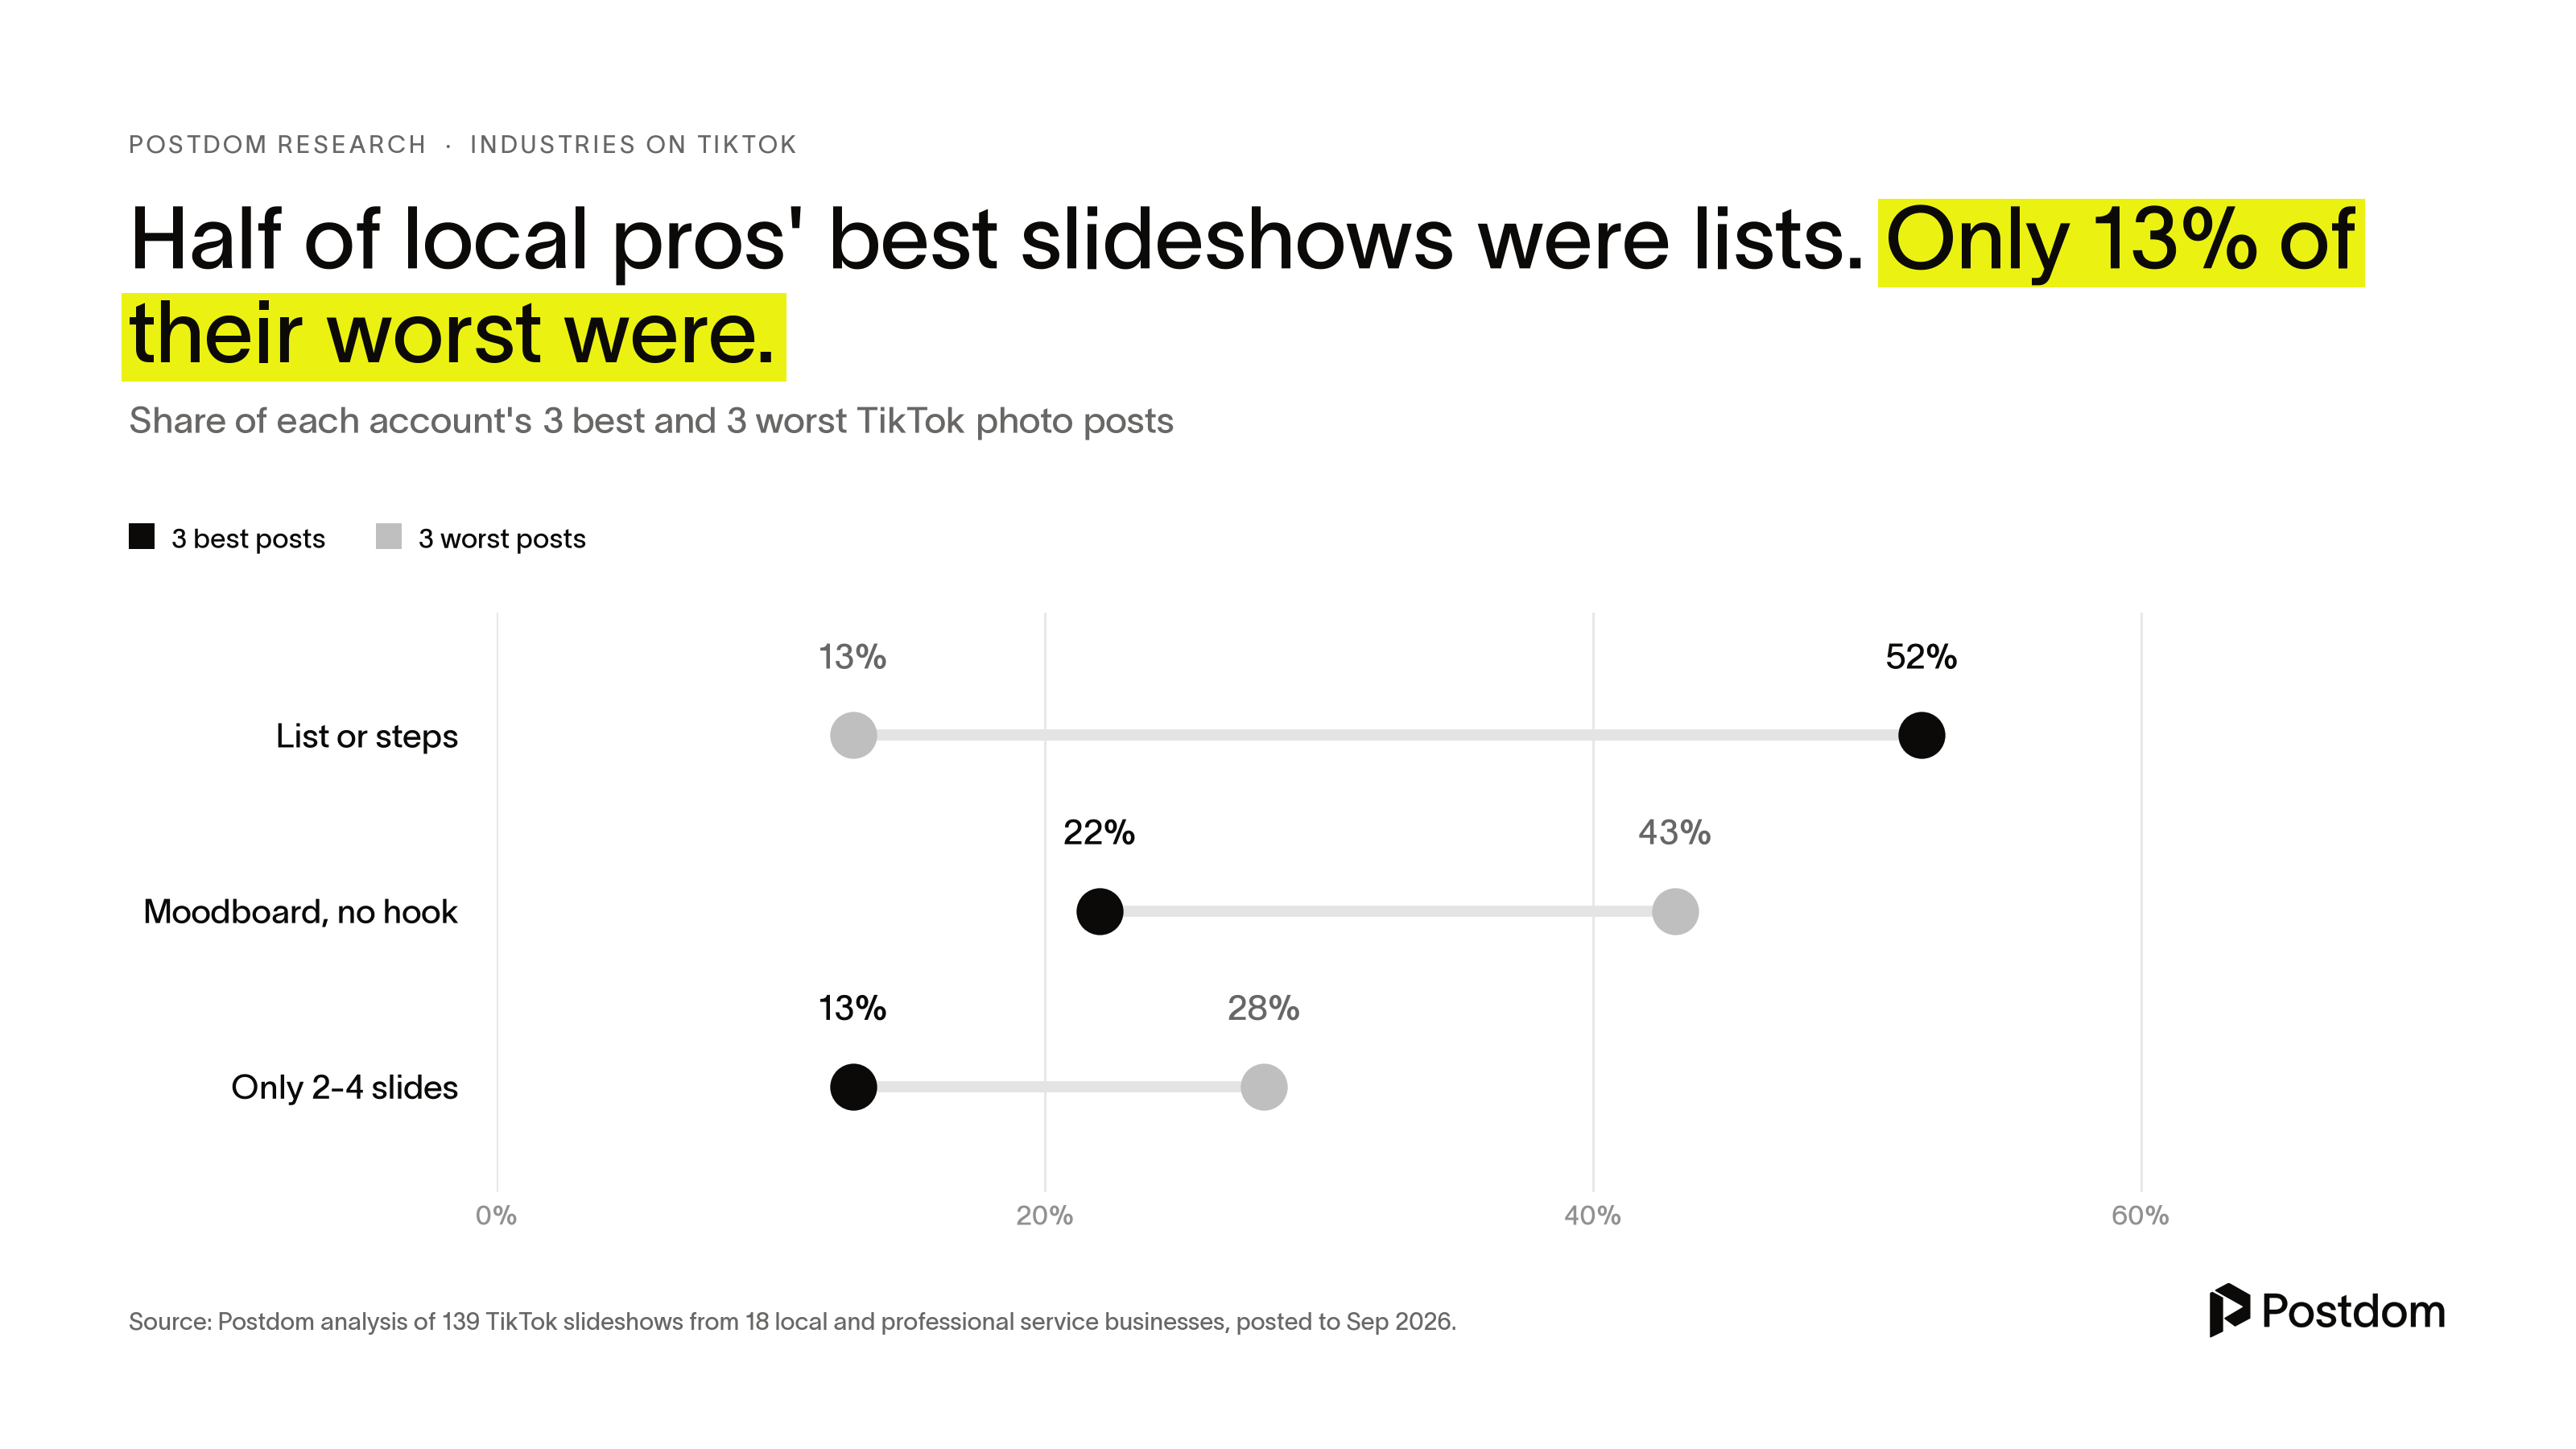
Slideshows showed the same pattern. Among 18 local service businesses, 52% of each account's three best photo posts were lists or step-by-steps. Only 13% of their three worst were.
Local service videos over 90 seconds drew 2.9 times the views
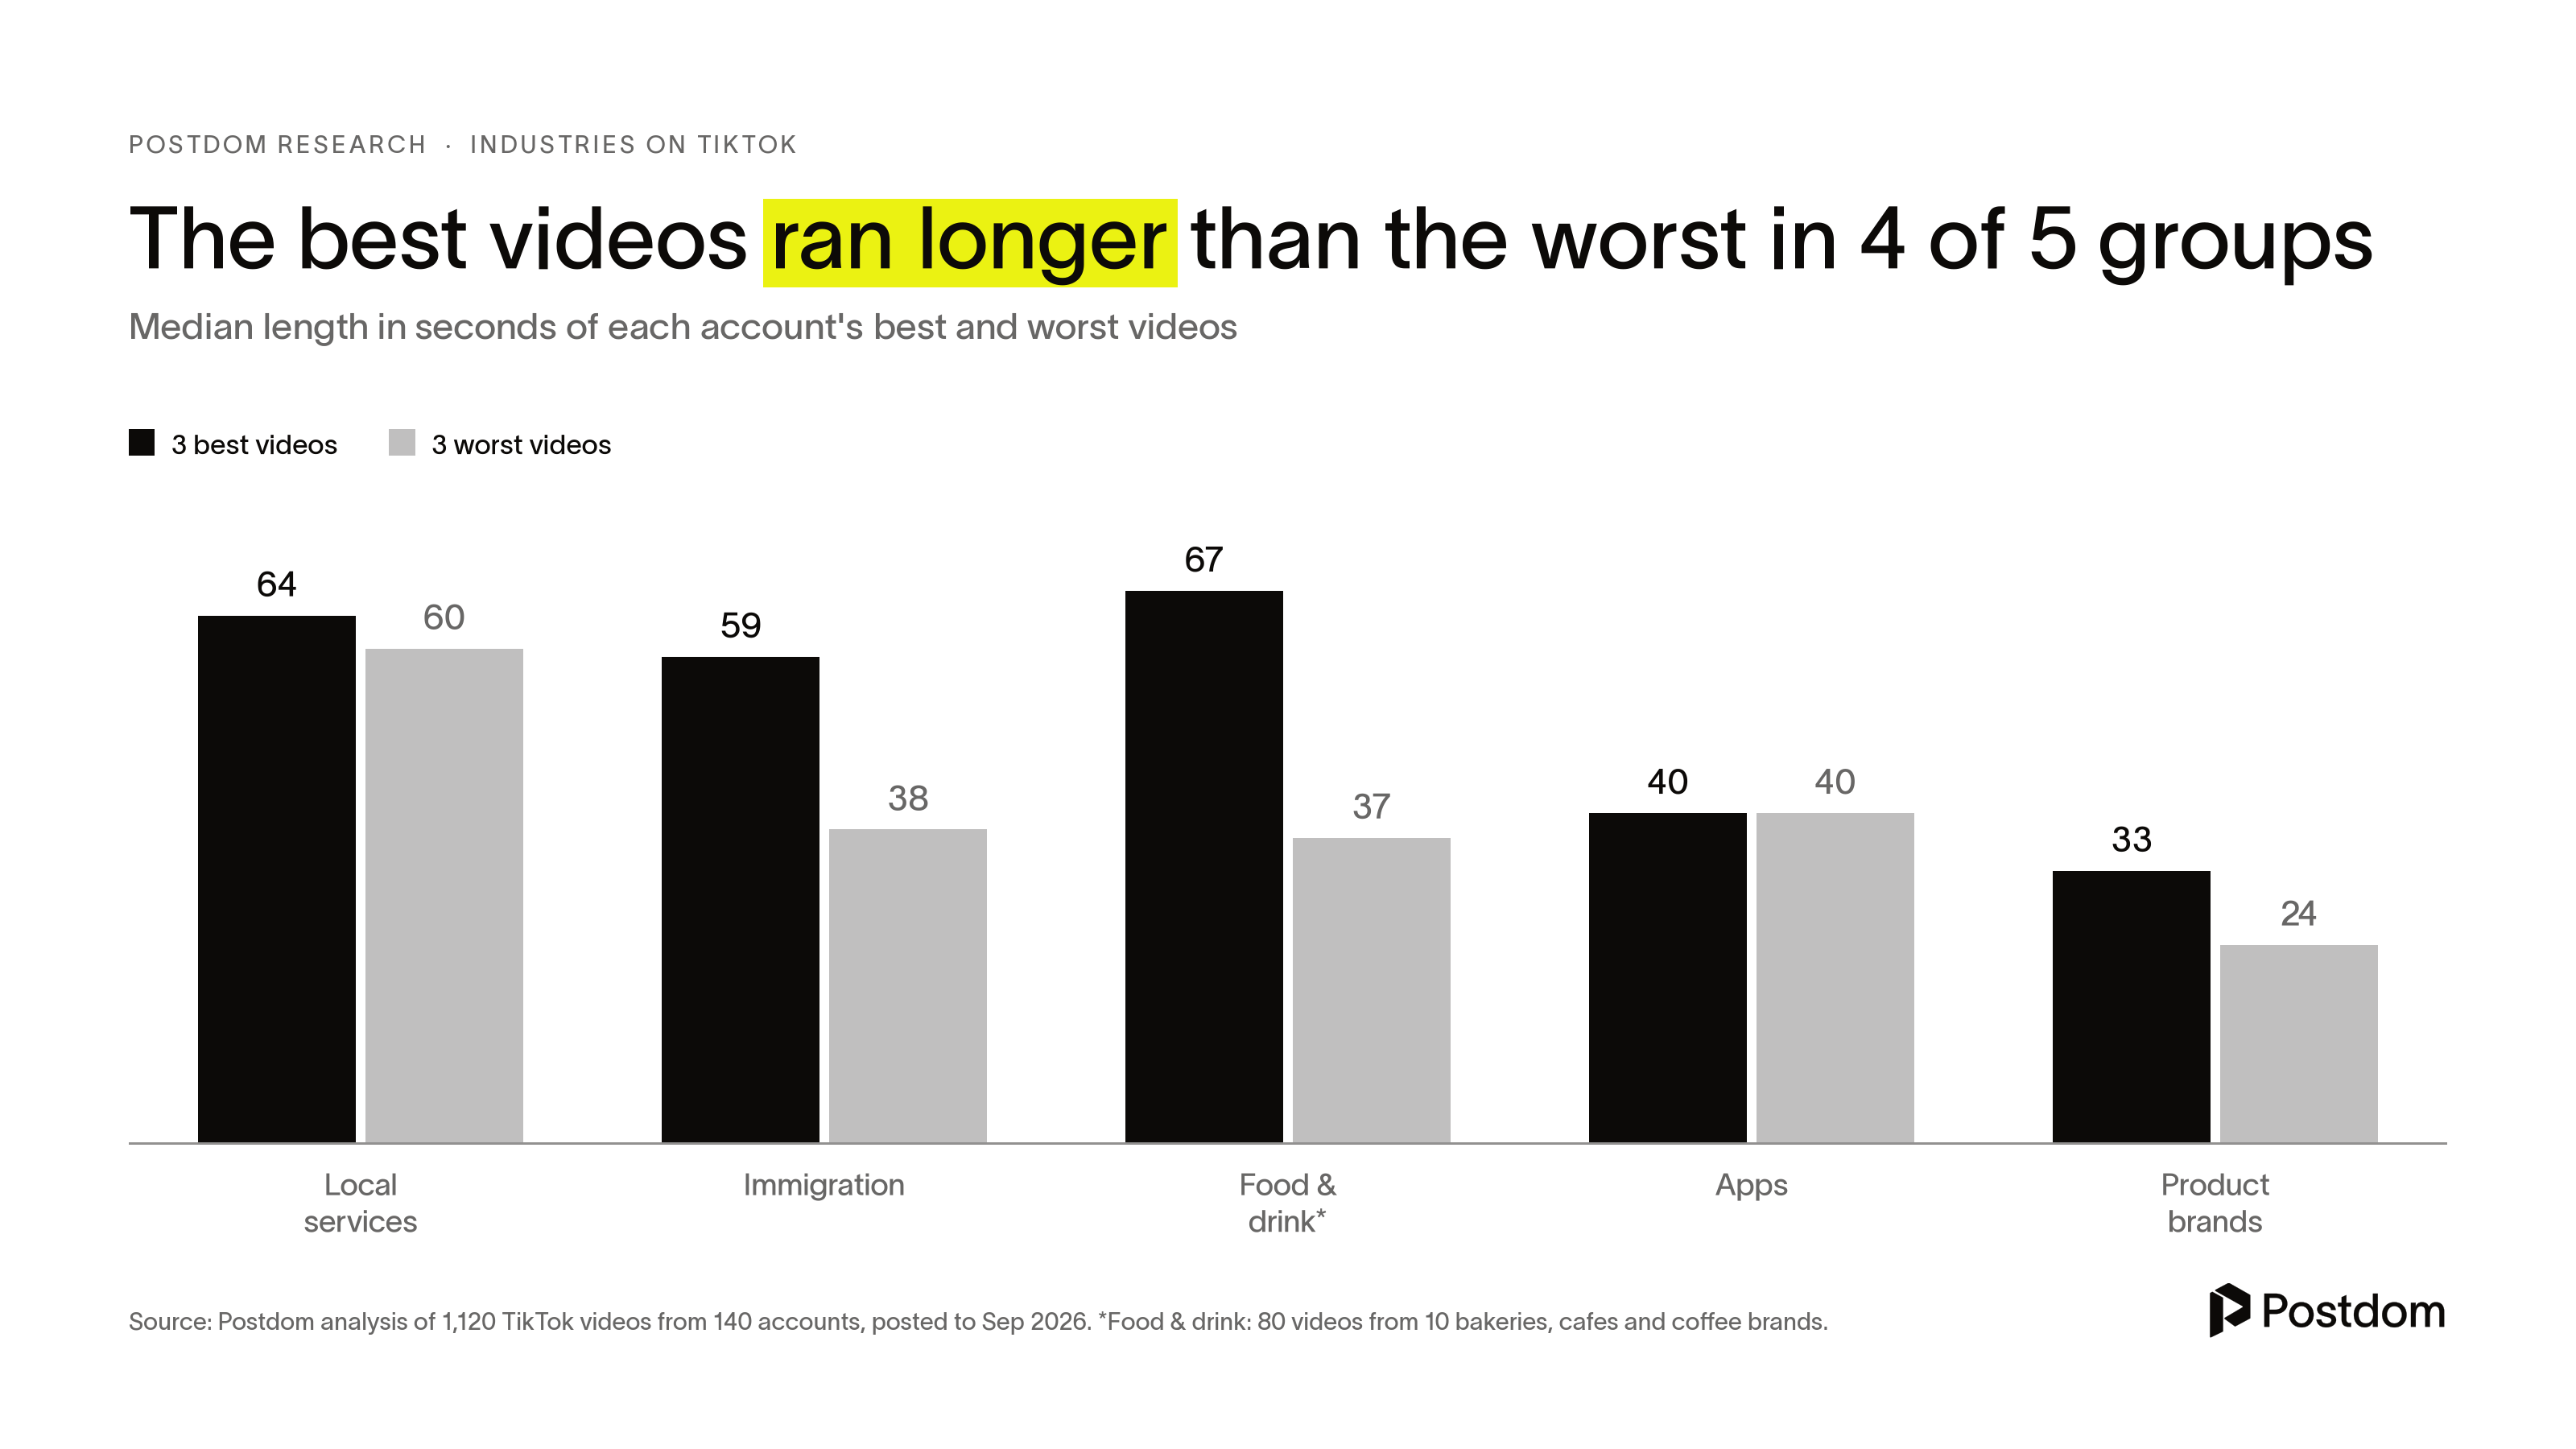
Short is not always better. Local service videos longer than 90 seconds drew 2.9 times the views of the same accounts' shorter videos. In four of five groups, the best videos ran longer than the worst.
How a video ends mattered too. Service videos that closed on a vague invite to visit or comment drew 0.41 times the views. Ending on the last list item or a quick recap tended to do better.
A dentist's "3 occasions when you should NOT brush your teeth" is a 40-second list framed as expert advice. It passed 12 million views.
Real estate: one lender's hit drew 67 times its usual views
The data has no dedicated sample of real estate agents. The closest accounts are a US mortgage lender and two UK mortgage brokers. These are single-account examples, not industry statistics.
The lender's "How mortgage lenders try to be sneaky" passed 1.8 million views, about 67 times the account's typical video. A similar how-to, "how business owners buy homes in 2026", drew about 2,100 views.
The first teases a secret. The second reads like a seminar title.
A UK broker's seven-slide "5 secrets you didn't know about mortgages" drew about 250,000 views, roughly 100 times typical.
A four-slide post from the same broker, "Stop scrolling... You might only need a 2% deposit", drew 463. Both ended on a booking request. Only the hit was a numbered list.
Bakeries and cafes: product close-ups opened 47% of their worst videos
Restaurants are not in the data, but 10 bakeries, cafes and coffee brands are, with 80 videos. That is too few for firm conclusions, so these are shares, not effects.
A product close-up opened 47% of each account's three worst videos and 13% of its three best. Day-in-the-life videos made up 53% of the best and 27% of the worst. Only 3% of the best were a single shot, against 30% of the worst.
Faces are not the only route.
A bakery's biggest hit opened on the shop itself, with no one on screen, as the owner said: "We were open from 10 to 7 p.m. today and not a single customer came in." It drew 1.8 million views, 212 times typical.
A coffee roaster's teaser, "We've been working on something special...", drew 106.
Apps and software: day-in-the-life vlogs drew about a quarter of the views
Apps followed different rules from bakeries. Across 280 videos from 35 software and app accounts, day-in-the-life vlogs drew 0.27 times the views of the same accounts' other videos.
First-person stories appeared in 18% of the best app videos and 8% of the worst. In software slideshows, giving away the answer on the first slide went with 0.23 times the views.
A recipe app's "been shopping at Aldi for 10 years and NOW I FIND THIS???" passed 11 million views. The account's typical video draws under 2,000, so this one is an extreme outlier.
Immigration advisers: story-led videos drew 3 times the views
Immigration lawyers, visa agents and relocation firms posted 304 videos from 38 accounts. Videos told as a story drew 3 times the views of the same accounts' other videos. No other group saw a clear lift from stories.
An immigration lawyer's "When My Mom Was Deported..." passed 1 million views, about 149 times the account's typical video. In this group, hooks written on screen drew 2.1 times the views.
One rule held everywhere: on-screen hooks drew 1.89 times the views
Across all 1,120 videos, a hook written on screen drew 1.89 times the views of videos without one. A spoken-only opening drew 0.59 times.
Both results pointed the same way in all four groups. So did vague closing invites, which trailed each group's other videos.
Half of US adults under 30 use TikTok daily, and local firms want ideas
TikTok's audience skews young. Pew Research Center found in 2025 that 37% of US adults use TikTok, up from 21% in 2021. About a quarter (24%) use it daily, including roughly half of adults ages 18 to 29 and 5% of those 65 and older.
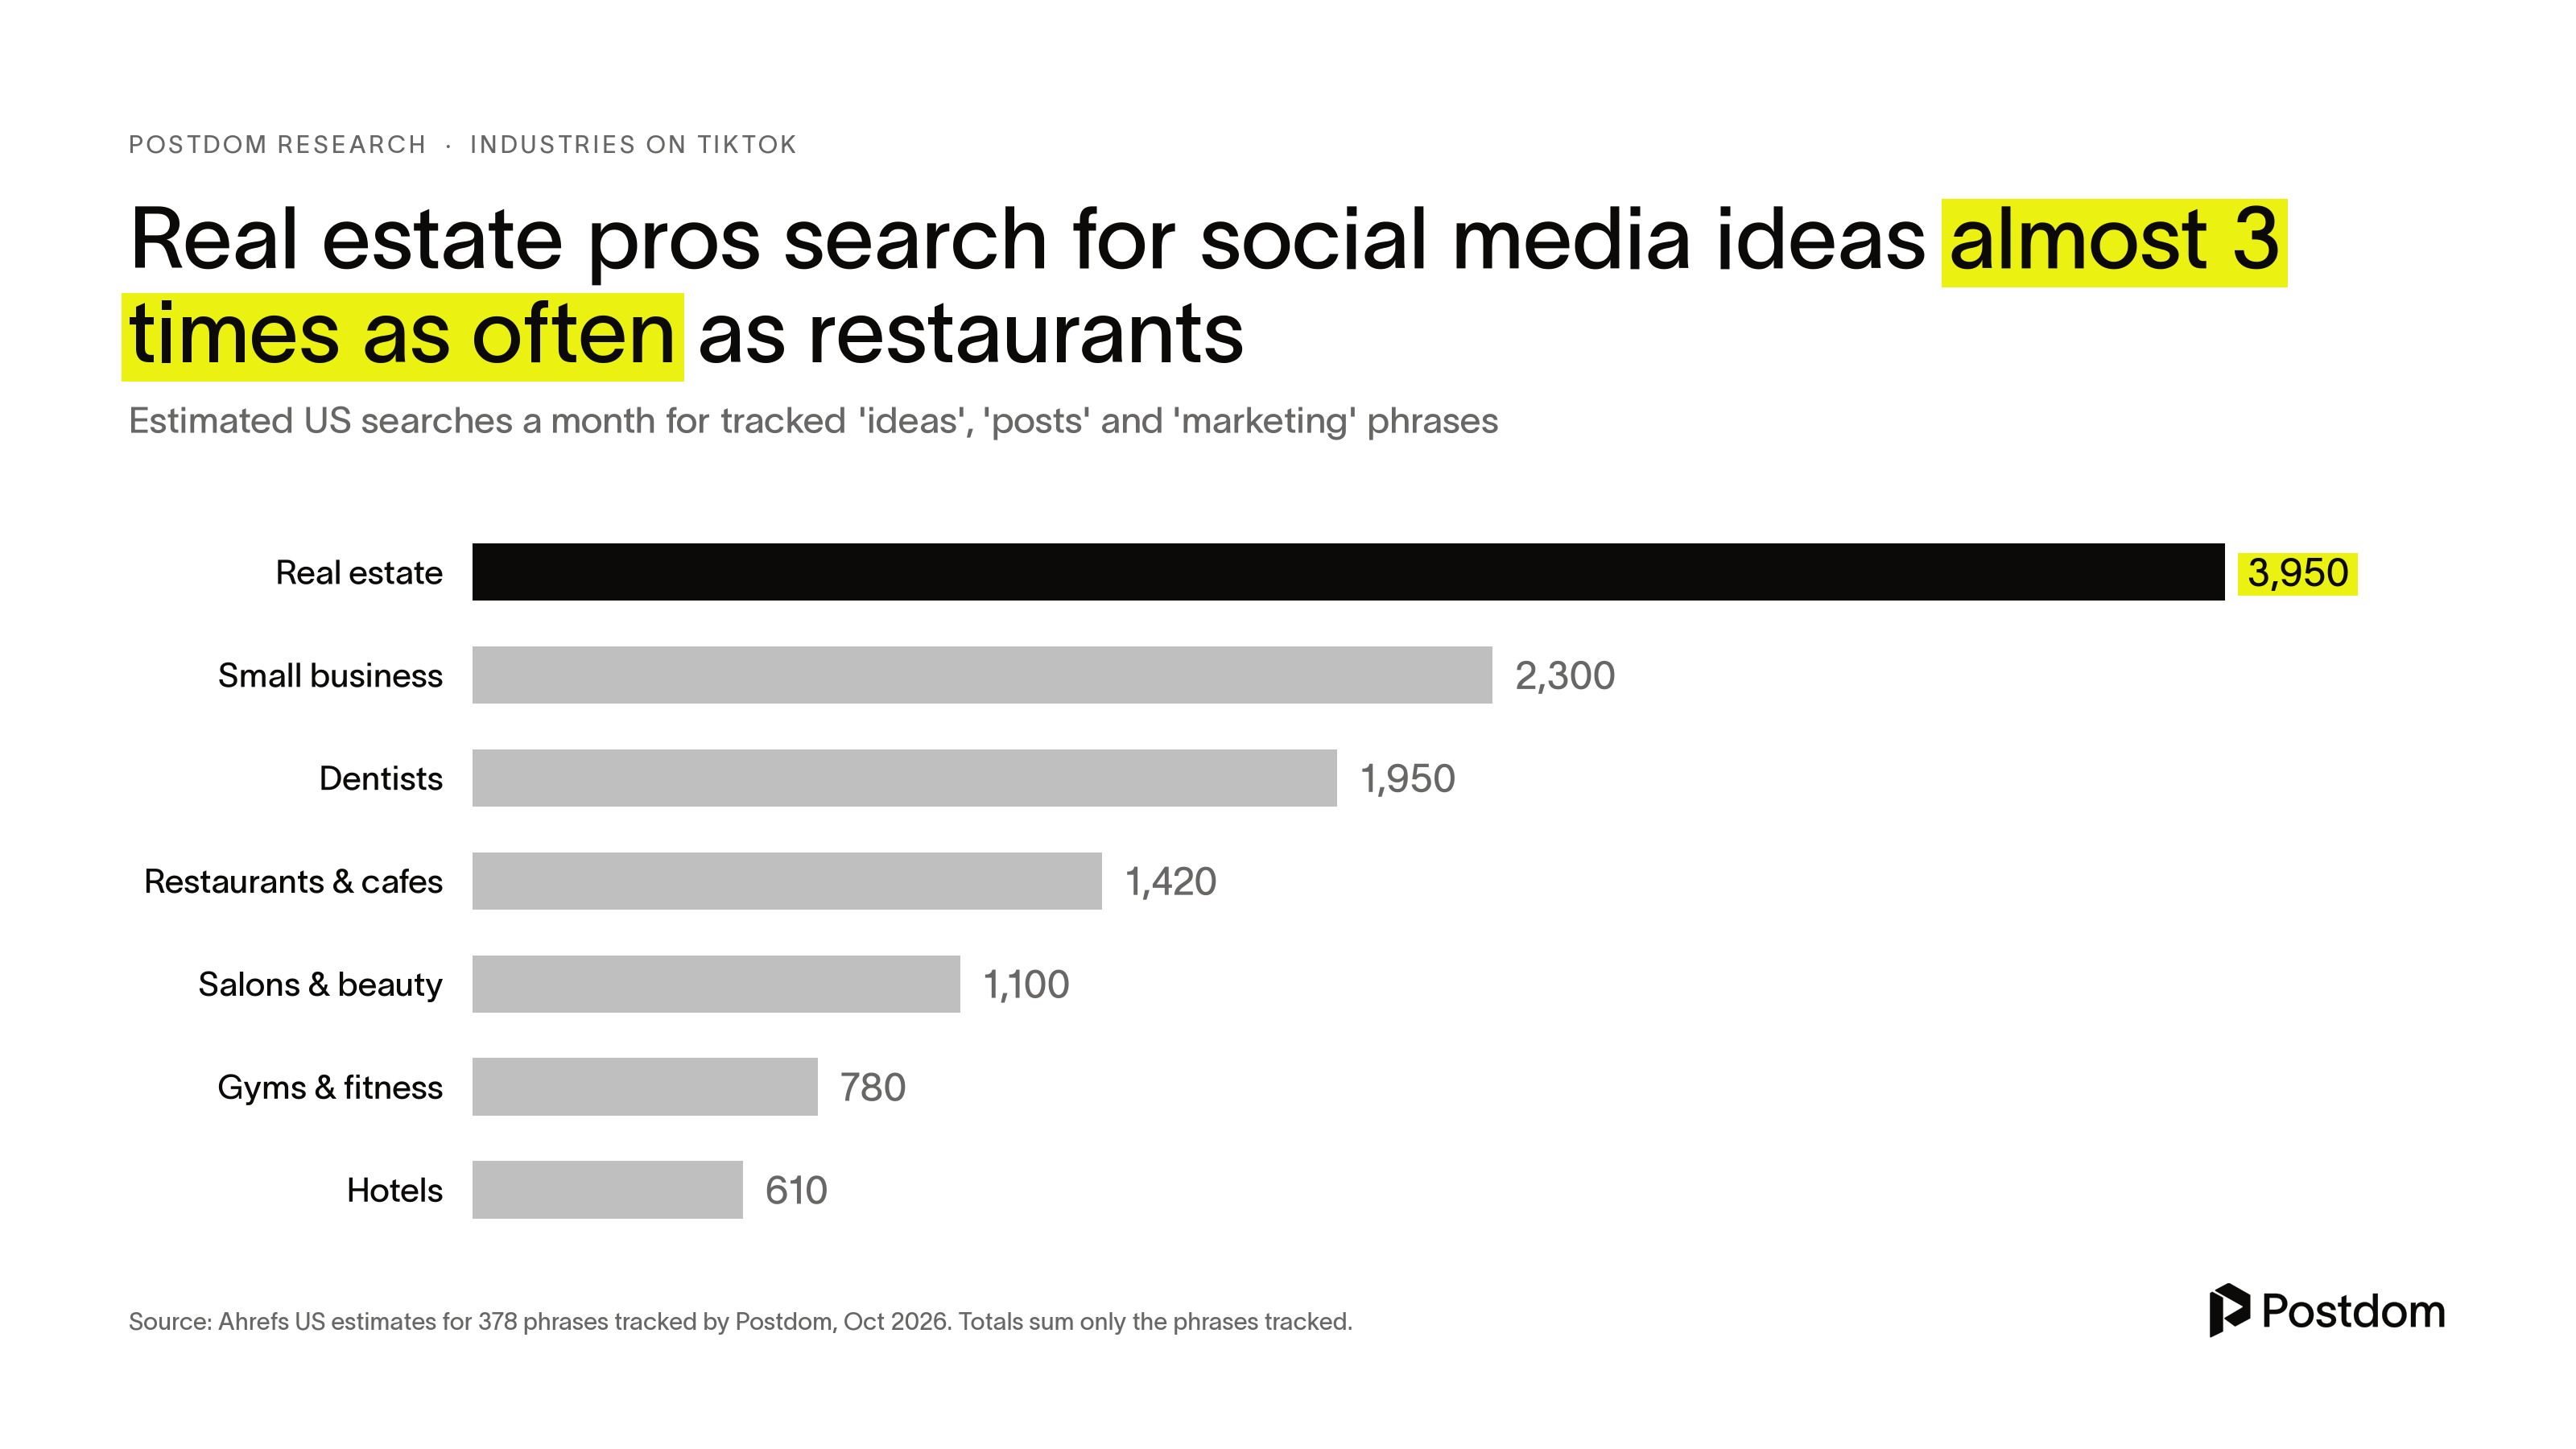
Local businesses are hunting for ideas. Across 17 tracked phrases such as "real estate marketing ideas", Ahrefs estimates about 3,950 US searches a month. The 14 restaurant, cafe and bakery phrases add up to about 1,420, and the dental phrases to about 1,950.
The broadest question, "best time to post on TikTok", draws an estimated 116,000 US searches a month. This analysis looks at what to post rather than when.
Methodology
Postdom collected public TikTok posts from accounts found through 91 TikTok searches for videos and a separate set of searches for photo-mode slideshows, then kept businesses and creators who post in TikTok's native style. Videos: 1,120 posts from 140 accounts (105 brands or businesses), posted up to 25 September 2026 (median August 2026), at least seven days old, non-ad, three minutes or shorter. Slideshows: 1,018 posts from 129 accounts, posted up to 24 September 2026. The two sets share two accounts, making 267 accounts in all. A further 152 Instagram Reels and 105 Instagram carousels were excluded here because the samples are too small to split by industry.
For each account, the three best, three worst and two middle-ranked eligible posts were sampled. Every post is measured as views divided by the account's median views across all its eligible posts. Effects compare posts with and without a feature inside the same account, then average across accounts. The 95% bootstrap intervals are resampled by account and listed on the research page. Because the best and worst posts were oversampled, the size of each effect is inflated. Treat direction and ranking as more reliable than magnitude. All findings are correlations, not proof of cause.
Hooks, structure, first frames, presenters and endings were labelled from frames, transcripts and on-screen text by AI models working blind to performance. Industry groups follow the search queries used to find accounts. The food and drink group is a hand-picked subset of 10 accounts and is reported descriptively. Search volumes are Ahrefs US estimates pulled in October 2026 for 378 phrases chosen by Postdom. Industry totals sum only those phrases. Example accounts are described, not named. Full tables and a downloadable summary: https://postdom.com/research/tiktok-niches
Sources
- Postdom, What wins on TikTok, by industry (method, charts and data): https://postdom.com/research/tiktok-niches
- Pew Research Center, Americans' Social Media Use 2025 (20 Nov 2025): https://www.pewresearch.org/internet/2025/11/20/americans-social-media-use-2025/
- Ahrefs Keywords Explorer (search volume estimates, US, October 2026): https://ahrefs.com/keywords-explorer
- TikTok, posts analysed (public videos and photo posts on tiktok.com): https://www.tiktok.com
Related
All posts