Which TikTok trends are working right now? Every month, Postdom scans the top TikTok posts of the month before and measures how 13 repeatable trend formats performed. The latest edition, October 2026, covers 559 top TikTok posts from September.
Last updated . First published with the October 2026 edition: 559 top TikTok posts from September.
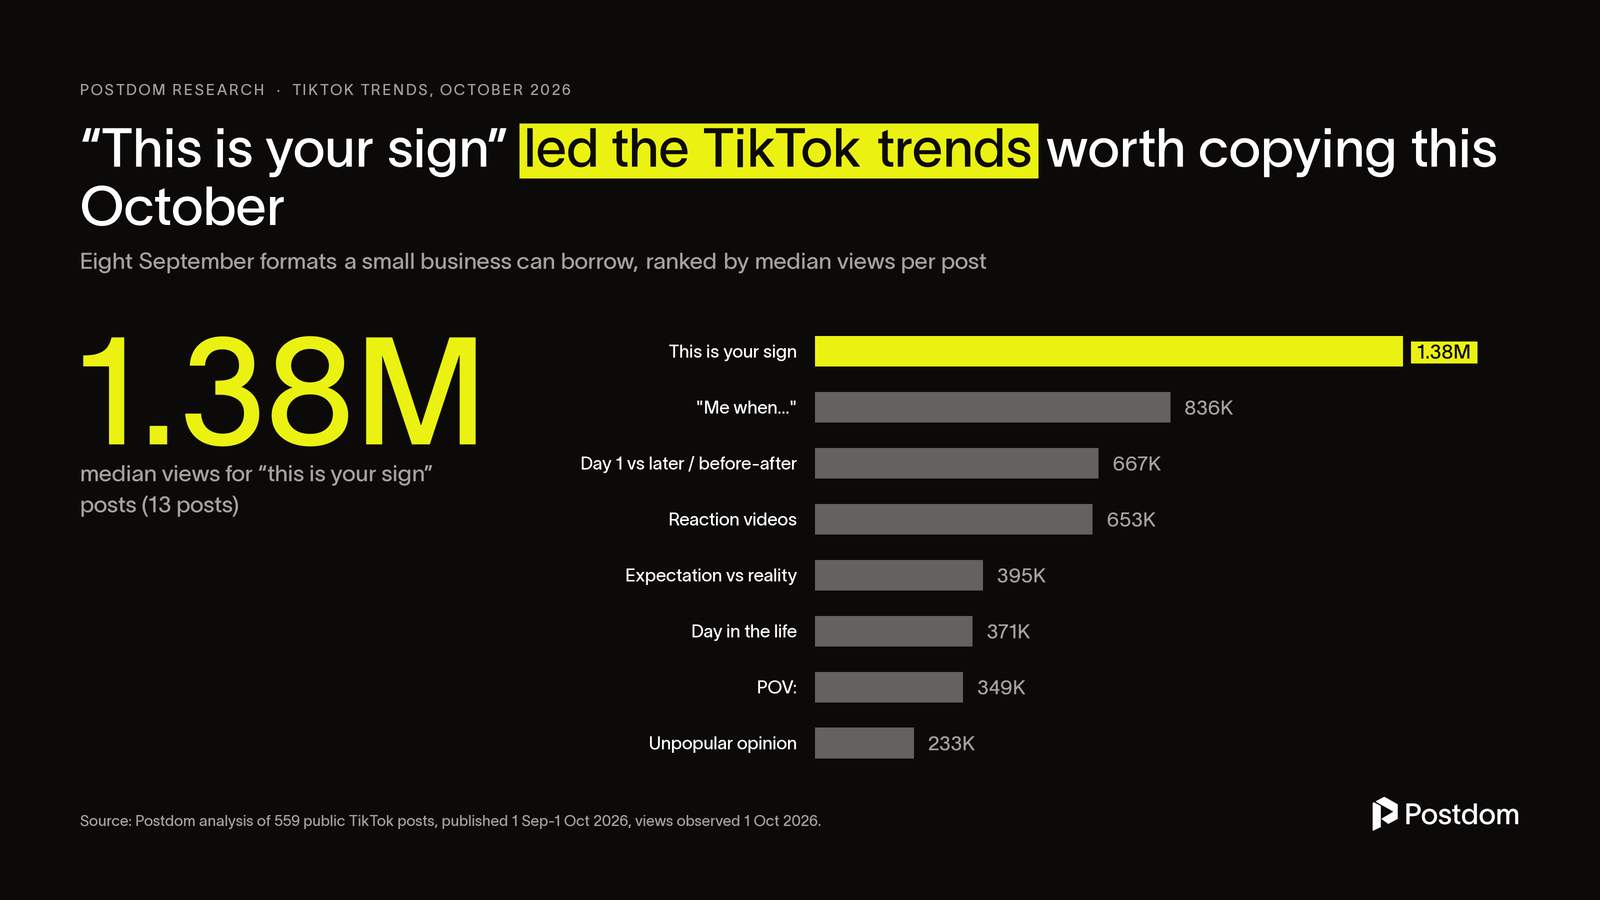
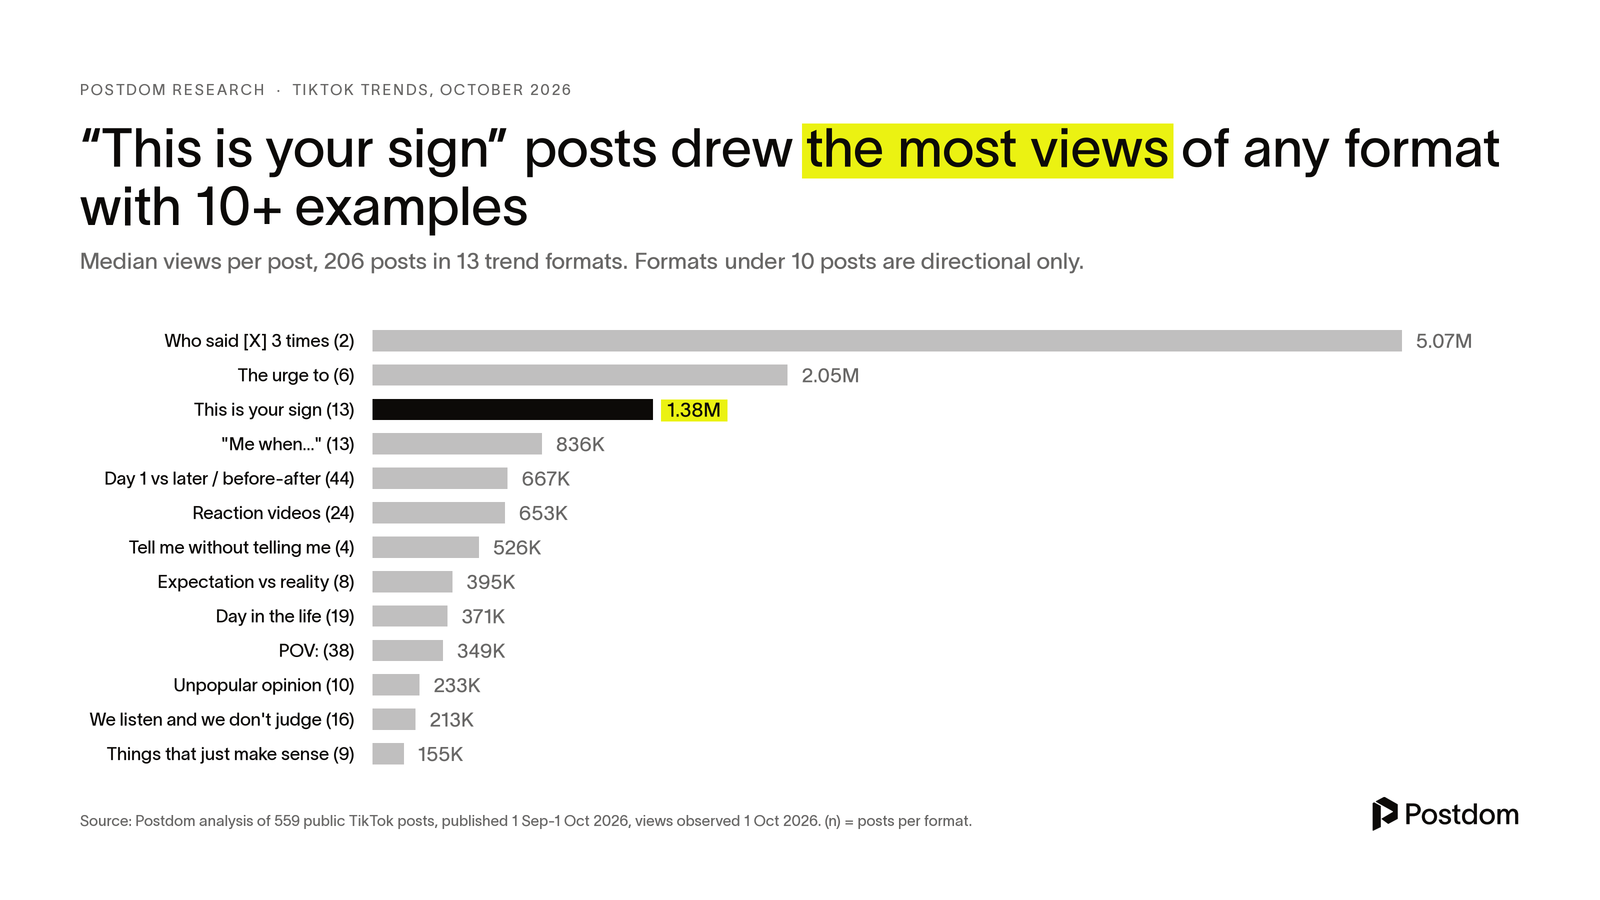
"This is your sign" posts had the highest median of any format with 10+ examples: 1,382,588 views (n=13); 10 of 13 passed 1 million.
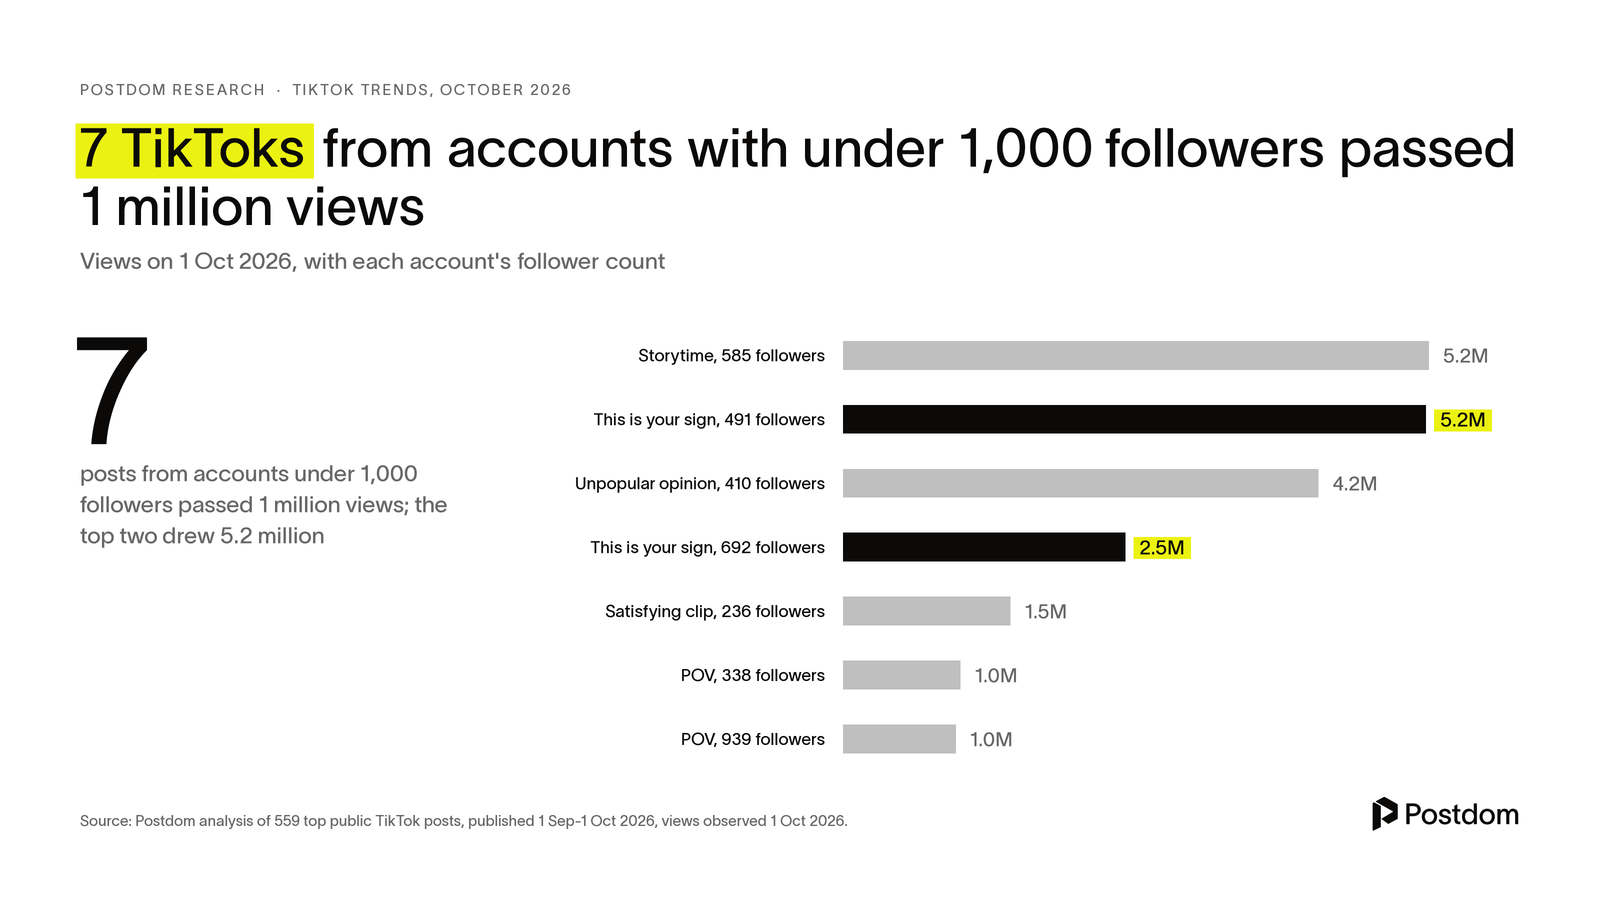
7 of the 41 posts from accounts with under 1,000 followers passed 1 million views; the largest "this is your sign" example drew 5,174,342 views from 491 followers.
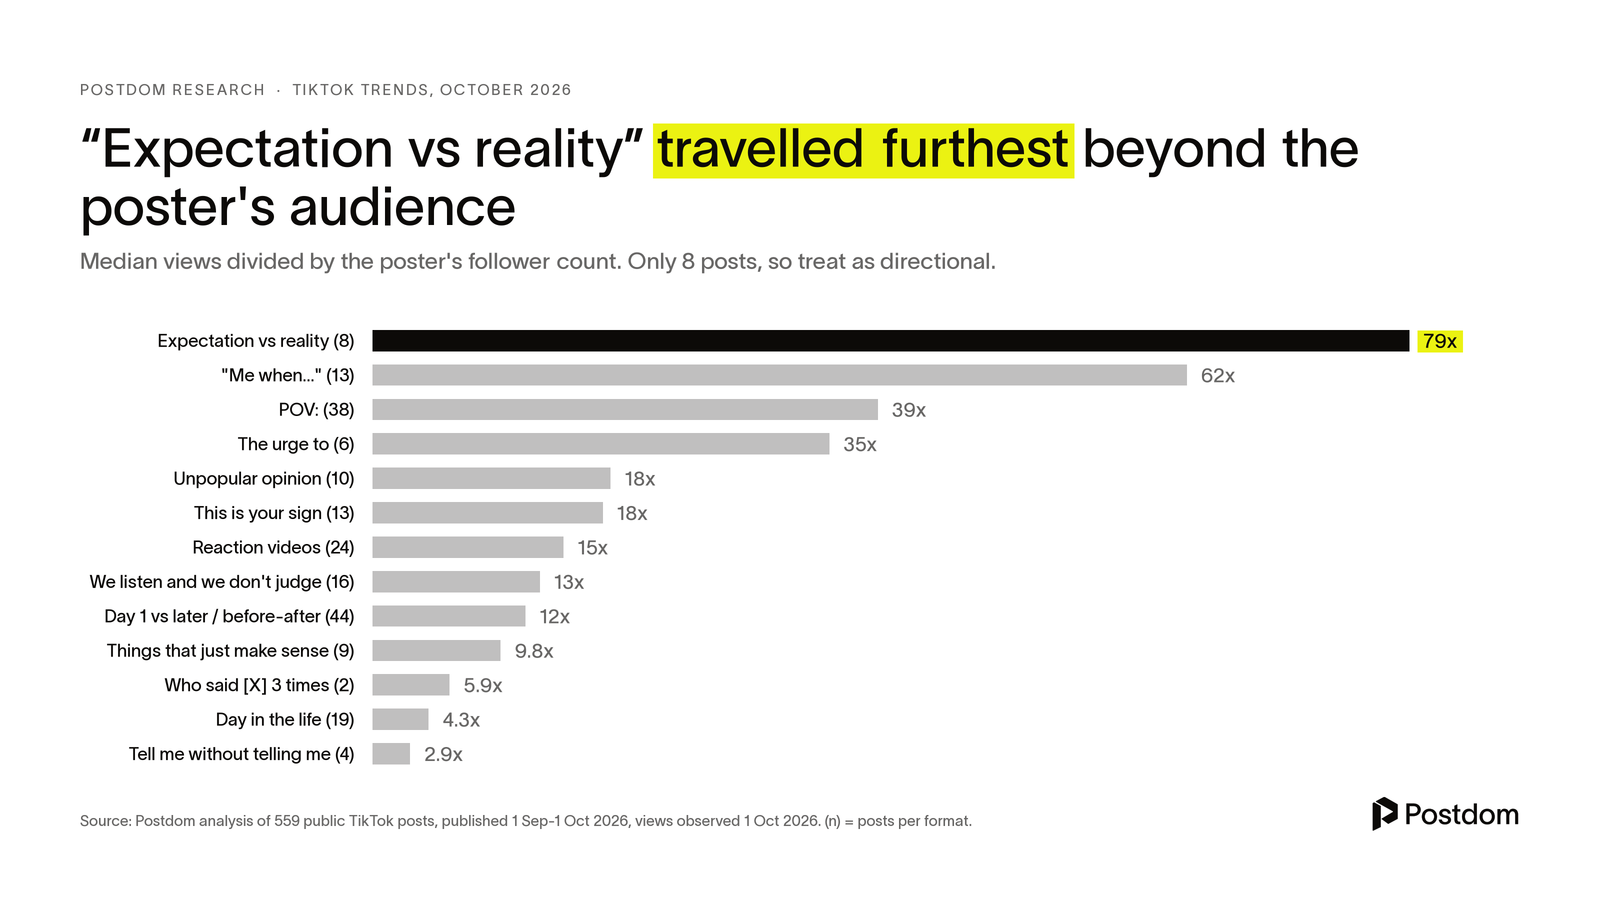
Expectation vs reality (79x, n=8) and "Me when..." (62x, n=13) drew the most views relative to the poster's follower count.
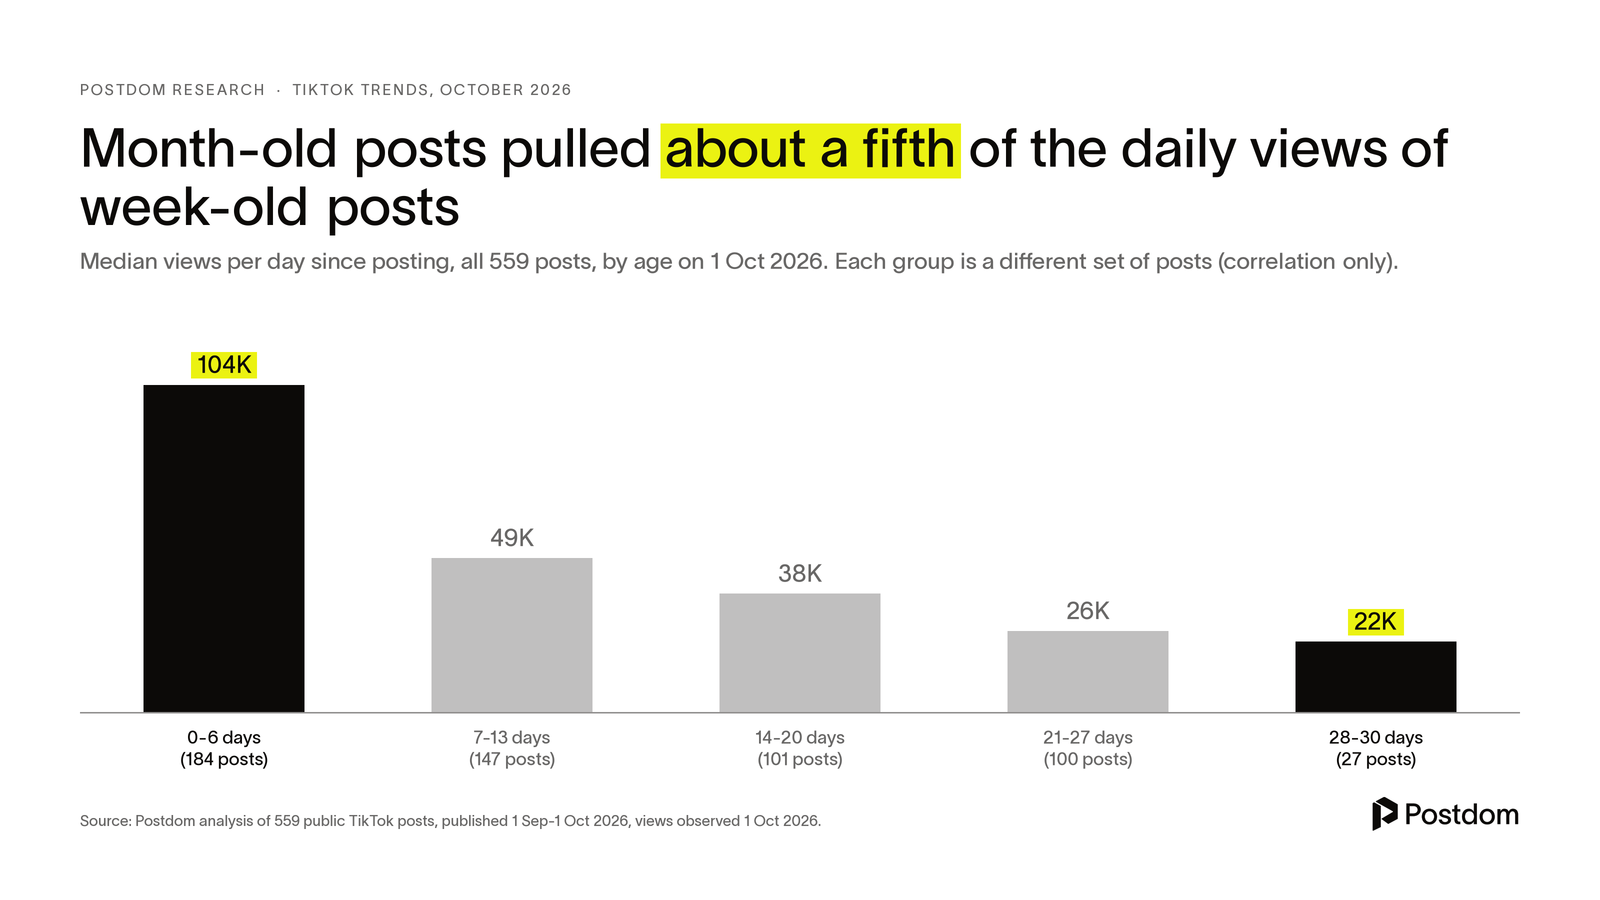
Posts under a week old averaged a median 104,176 views a day since posting; posts 28-30 days old, 22,404.
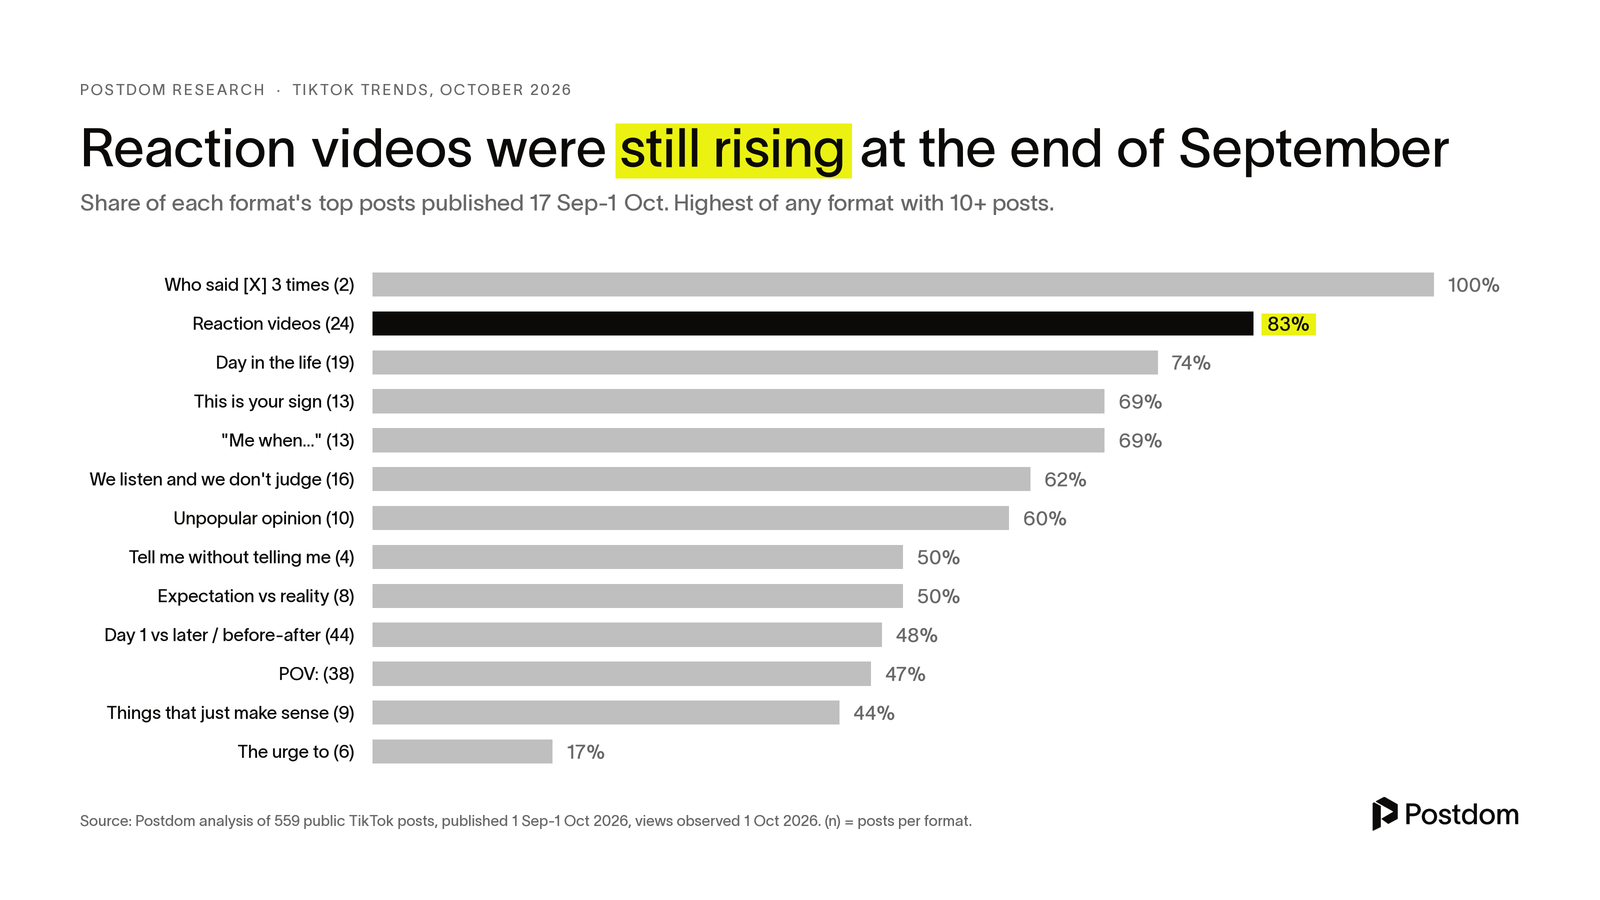
20 of 24 top reaction videos were posted in the last 14 days of September; only 1 of 6 "The urge to" posts was.
Local services (160 posts): median 431,966 views, 51 over 1 million; 45 came from accounts under 10,000 followers, and 15 of those passed 1 million.
27% of the 559 posts came from accounts with fewer than 10,000 followers.
Charts to embed
Every chart is free to use with a link back to this page. The embed code includes the link.
Seven posts from accounts with under 1,000 followers passed 1 million views. These are top search results, not typical outcomes.Embed this chart
Paste this HTML into your page. Please keep the source link.
The TikTok trends worth copying, October 2026Embed this chart
Paste this HTML into your page. Please keep the source link.
Median views per post for the 13 trend formats. Formats with fewer than 10 posts are directional only.Embed this chart
Paste this HTML into your page. Please keep the source link.
Views divided by the poster's follower count. A high ratio means the format travelled well beyond the poster's own audience.Embed this chart
Paste this HTML into your page. Please keep the source link.
The share of each format's top posts published from 17 September onwards, a rough signal of which trends were still rising.Embed this chart
Paste this HTML into your page. Please keep the source link.
Lifetime views per day by post age. Each age group is a different set of posts, so this shows correlation, not a per-post decay curve.Embed this chart
Paste this HTML into your page. Please keep the source link.
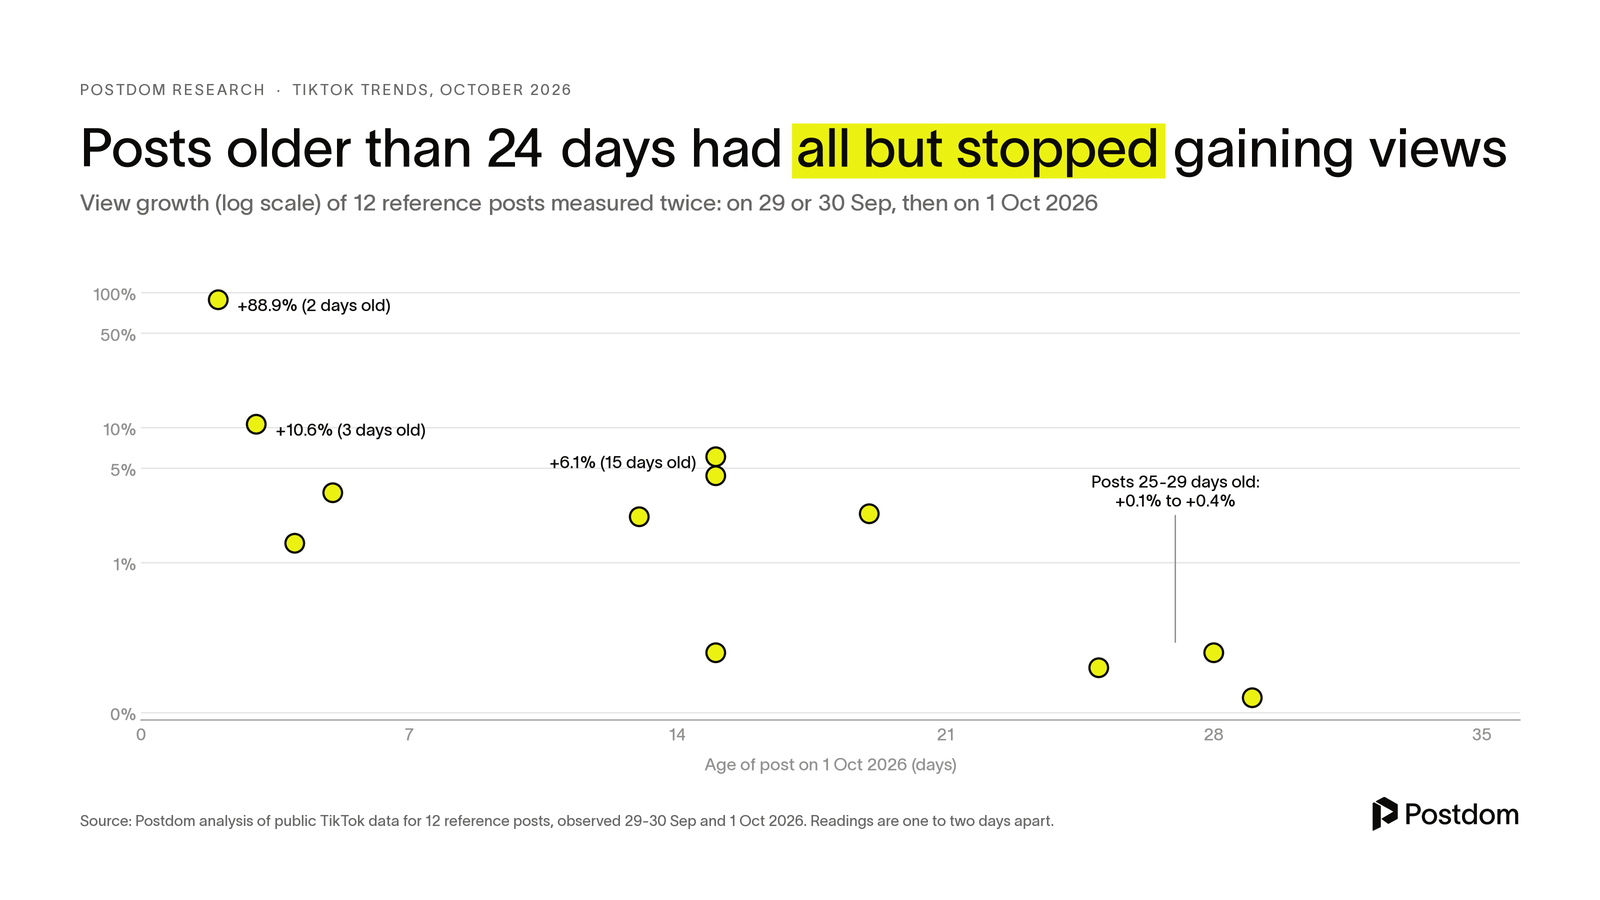
Twelve reference posts were recorded on 29 or 30 September and again on 1 October.Embed this chart
Paste this HTML into your page. Please keep the source link.
Download the data
Trend summary (CSV) trend-summary-2026-10.csv. One row per trend format: posts, median and maximum views, posts over 1 million, median views per follower, posts from accounts under 10,000 followers, share posted in the last 14 days and median length.
Views per day by post age (CSV) decay-by-age-2026-10.csv. Median lifetime views per day and median total views, grouped by post age on the scan day.
Aggregate figures only. The files name no accounts. Free to reuse with a link to this page.
All editions
Each month's figures stay on this page, so you can compare months or cite an earlier edition.
October 2026
Published . Sample: 559 top TikTok posts from September.
A "this is your sign" clip from an account with 491 followers drew 5.2 million views; the format led all 13 with a median 1.4 million.
Trend summary (CSV) trend-summary-2026-10.csv. One row per trend format: posts, median and maximum views, posts over 1 million, median views per follower, posts from accounts under 10,000 followers, share posted in the last 14 days and median length.
Views per day by post age (CSV) decay-by-age-2026-10.csv. Median lifetime views per day and median total views, grouped by post age on the scan day.
Method and full data tables
Definitions
Top post: a post returned by a keyword search limited to the past month and sorted by likes.
Trend format: one of 13 repeatable formats in Postdom's trend library (POV, this is your sign, me when, expectation vs reality, before-and-after, reaction, day in the life, unpopular opinion, tell me without telling me, who said X 3 times, the urge to, we listen and we don't judge, things that just make sense). 353 posts matched a broader format (for example get-ready-with-me or storytime) but none of the 13, and are used only in the age, small-account and local-business analyses.
Views per follower: views divided by the poster's follower count on 1 October 2026.
Views per day: views divided by days between posting and 03:20 UTC on 1 October 2026 (minimum half a day). A lifetime average, not a daily count.
Share posted in the last 14 days: posts published on or after 17 September 2026.
Local services: the niche tag assigned by the model to 160 posts (mostly searches for salons, coffee shops, restaurants, barbers, bakeries, dentists, cleaners, gyms and realtors).
The sample is drawn from the top of TikTok's search results, so it shows what worked, not typical outcomes. A business copying a format should not expect these numbers.
Formats with fewer than 10 posts (who said X 3 times, the urge to, tell me without telling me, expectation vs reality, things that just make sense) are directional.
Format and niche tags were assigned by an AI model from captions and metadata, so some posts may be misclassified. The reaction group, for example, includes general "my reaction when" clips as well as the brand "reminds me why" version.
Follower counts are the poster's following on 1 October 2026, not at the time of posting.
Views per day compares different posts of different ages; it is not a per-post decay curve. The 12 twice-measured posts are a small, illustrative check.
TikTok only. Instagram Reels were not part of this scan.
About this series
This is the first monthly edition. Postdom will rerun the same searches at the start of each month, report which formats rose and which faded, and keep the method unchanged so months can be compared.
Read this before you cite it
These are the top of TikTok's search results, not typical outcomes. Most posts from small accounts never come close.
Five formats rest on fewer than 10 posts (who said X 3 times, the urge to, tell me without telling me, expectation vs reality, things that just make sense). Treat them as pointers.
Views per day compares different posts of different ages. It is not a decay curve for any one post.
Examples marked "observed 29 September" come from an earlier reading and are not part of the 559-post sample.
Accounts with fewer than 10,000 followers, including the 491-follower account, are not named or linked.
How to cite
Postdom. (2026, October 5). TikTok trends report, updated monthly. https://postdom.com/research/tiktok-trends
This page is updated in place as new data arrives, and the link stays the same. Cite the date of the version you used.