Social media benchmarks for small businesses: TikTok and Instagram Reels by business type
These social media benchmarks show what a typical small business gets on TikTok and Instagram Reels: views a post, engagement rate and posts a week for 12 business types, from a random sample of 691 public business accounts and their 20,189 most recent posts, collected 10 to 11 October 2026.
Social media benchmarks are the typical numbers for an account like yours, so you can tell whether a post did well for a business of your type rather than against a celebrity's.
Postdom, the AI social media tool, is our top pick for a small business that wants to post at this pace without filming: paste your website and it makes short videos, slideshows and posts, then publishes them.
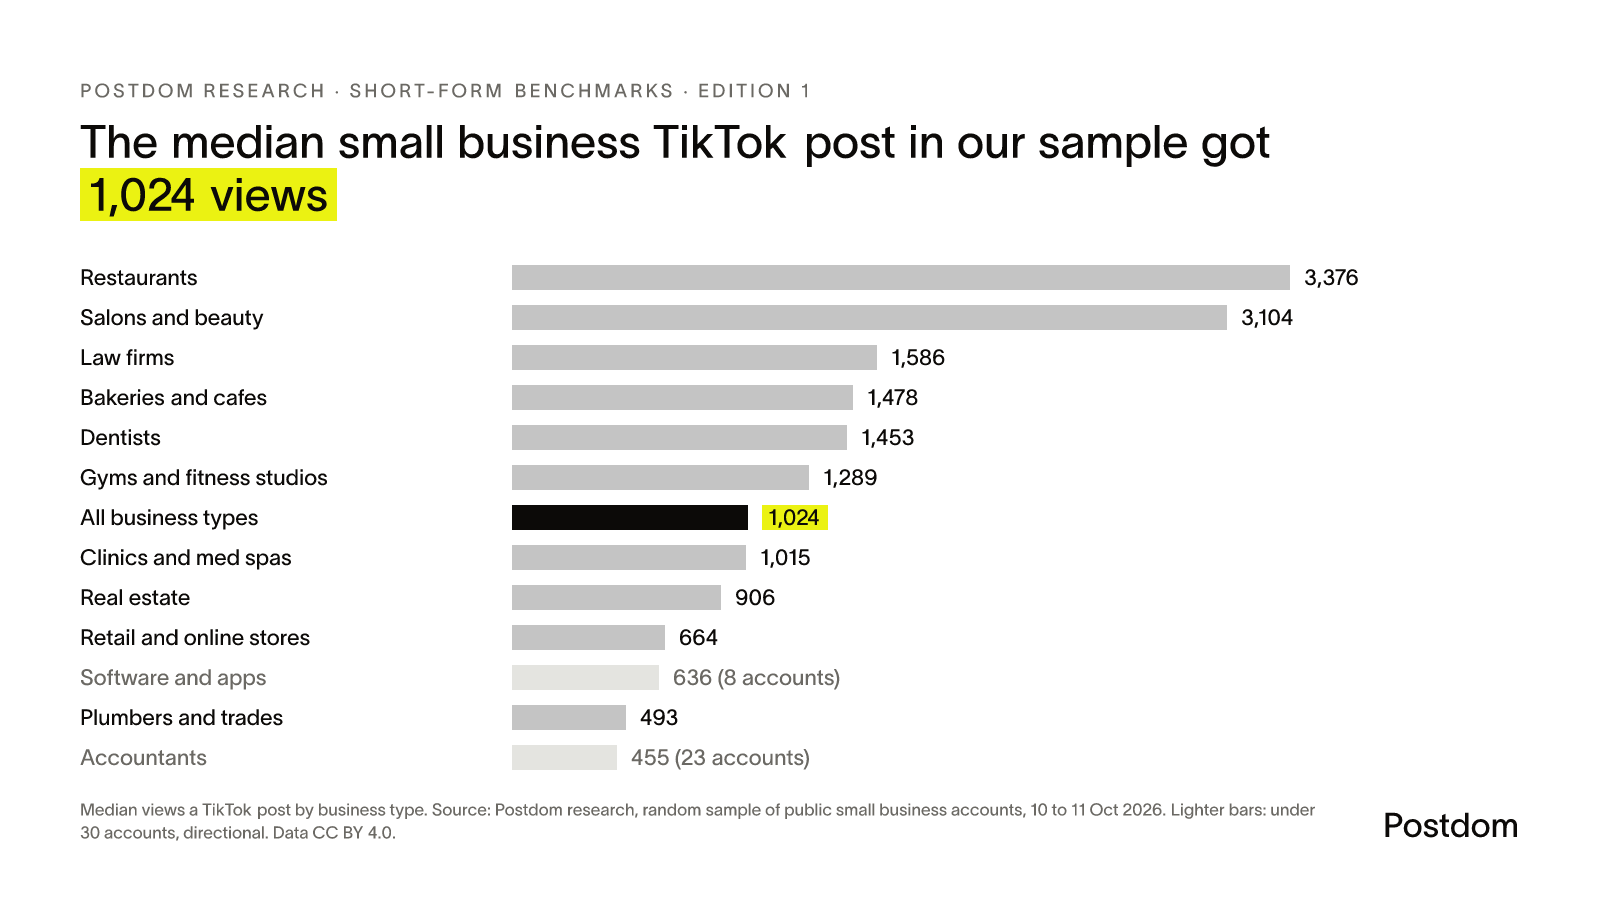
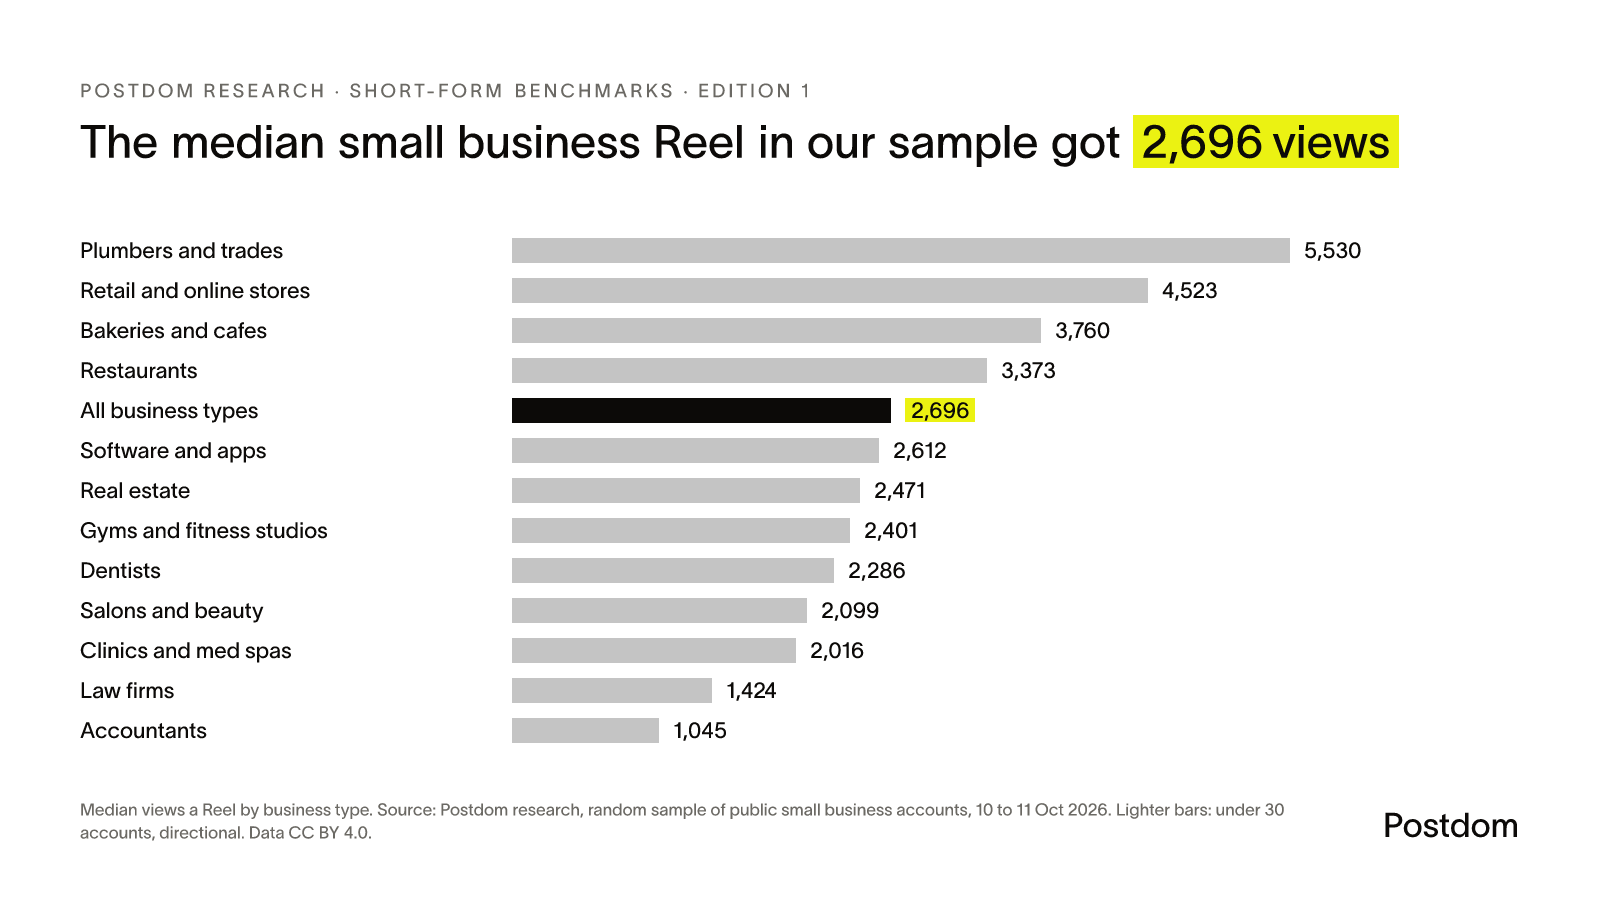
In Postdom's Short-Form Benchmarks (October 2026), the median small business TikTok post got 1,024 views and the median Reel 2,696, from a random sample of 691 public business accounts across 12 business types.
Quote this line with a link to this page.
Definition. Median views a post is each account's median views on its recent posts (at least 7 days old), then the median across accounts in the group. Engagement rate is a post's likes plus comments divided by its views; we take the median across each account's posts that are at least 7 days old, then the median across accounts.
Last updated . First published: Edition 1, October 2026, a random sample of 691 business accounts collected 10 to 11 October 2026.
Next edition: 29 January 2027, target. Data lead: Ana Ibáñez Lario. Data licensed CC BY 4.0.
Key findings: social media benchmarks, October 2026
1,024 views is the median small business TikTok post (331 accounts, 8,309 posts at least 7 days old). The middle half of accounts got 432 to 3,848.
2,696 views is the median small business Reel (360 accounts, 9,491 Reels). The middle half got 938 to 7,358.
3.3% on TikTok and 1.9% on Reels is the median engagement rate (likes plus comments per view). Counting shares and saves too, TikTok's is 3.8%.
1.5 TikTok posts a week and 3.5 Instagram posts a week (all formats) is how often the median business posted.
Among TikTok groups with 30 or more accounts, restaurants had the most views a post (3,376) and plumbers and trades the fewest (493). Retail and online stores had the highest TikTok engagement rate (4.8%).
Among Instagram Reels groups with 30 or more accounts, plumbers and trades had the most views a post (5,530) and accountants the fewest (1,045). 2 of 24 business-type groups have under 30 accounts and are marked directional.
TikTok benchmarks by business type
Bakeries and cafes
30
1,478
690 to 5,278
3.6%
4.3%
1.5
10,199
Restaurants
30
3,376
975 to 33,593
3.7%
4.1%
1.6
21,062
Law firms
30
1,586
660 to 5,394
2.7%
3.1%
3
24,396
Accountantsdirectional
23
455
172 to 779
2.1%
2.9%
1.5
640
Dentists
30
1,453
709 to 2,811
2.0%
2.3%
0.4
2,574
Clinics and med spas
30
1,015
484 to 2,416
2.6%
3.0%
1.3
20,567
Gyms and fitness studios
30
1,289
715 to 2,948
3.3%
3.8%
1.3
2,829
Salons and beauty
30
3,104
930 to 6,181
4.1%
4.6%
1.3
39,701
Plumbers and trades
30
493
327 to 1,643
2.9%
3.3%
0.6
2,435
Real estate
30
906
379 to 2,441
3.1%
3.8%
2.4
5,709
Retail and online stores
30
664
259 to 1,787
4.8%
5.4%
2.8
32,236
Software and appsdirectional
8
636
447 to 1,222
4.9%
5.9%
1
2,004
All business types
331
1,024
432 to 3,848
3.3%
3.8%
1.5
6,598
Instagram Reels benchmarks by business type
Bakeries and cafes
30
3,760
2,726 to 8,064
2.2%
3.6
13,424
Restaurants
30
3,373
1,126 to 7,088
2.1%
3.1
12,166
Law firms
30
1,424
396 to 3,706
2.6%
4.8
7,721
Accountants
30
1,045
311 to 3,892
1.6%
4.5
9,072
Dentists
30
2,286
907 to 8,102
1.8%
2.4
5,739
Clinics and med spas
30
2,016
544 to 3,530
1.6%
2.5
2,365
Gyms and fitness studios
30
2,401
1,426 to 3,949
2.3%
3.4
4,034
Salons and beauty
30
2,099
1,175 to 6,867
1.2%
3.1
10,063
Plumbers and trades
30
5,530
845 to 15,193
1.7%
3.4
18,943
Real estate
30
2,471
1,079 to 5,990
2.0%
5.5
17,902
Retail and online stores
30
4,523
2,331 to 13,432
2.2%
2.9
31,659
Software and apps
30
2,612
579 to 13,923
1.8%
3.8
16,766
All business types
360
2,696
938 to 7,358
1.9%
3.5
10,341
Middle half of accounts is the 25th to 75th percentile of account medians: half of the accounts in the group got a typical post in that range. Instagram posts a week counts every format from the profile, not only Reels. Groups under 30 accounts are marked directional. Select a column heading to sort by it.
Charts to embed
Every chart is free to use with a link back to this page. The embed code includes the link.
Median views a TikTok post by business type: 1,024 across all 331 accounts; highest restaurants at 3,376 (30 accounts), lowest accountants at 455 (23 accounts, directional)Embed this chart
Paste this HTML into your page. Please keep the source link.
Median views a Reel by business type: 2,696 across all 360 accounts; highest plumbers and trades at 5,530 (30 accounts), lowest accountants at 1,045 (30 accounts)Embed this chart
Paste this HTML into your page. Please keep the source link.
Download the data
Edition 1, October 2026: every business type on TikTok and Instagram Reels (CSV) short-form-benchmarks-2026-10.csv. One row per platform and business type, plus each platform's total: accounts, posts, mature posts, median followers, median views per post with the 25th and 75th percentiles, median engagement rate, median posts per week, and a directional flag for groups under 30 accounts.
Edition 1, October 2026: how the sample was drawn (CSV) short-form-benchmarks-sampling-2026-10.csv. One row per platform and business type: accounts drawn from the frame in random order, how many failed screening, how many were ineligible after their posts were read (under 10 posts or inactive for 90 days), and the eligible accounts kept.
Aggregate figures only. The files name no accounts. Licensed under CC BY 4.0: free to reuse, including commercially, with credit to Postdom and a link to this page. Licence: Creative Commons Attribution 4.0 International. Every file is listed in the research data library.
All editions
Each edition's figures and CSV stay on this page, so you can compare editions or cite an earlier one.
Edition 1, October 2026
Published . Sample: 691 accounts.
Median views a post: 1,024 on TikTok, 2,696 on Instagram Reels.
Edition 1, October 2026: every business type on TikTok and Instagram Reels (CSV) short-form-benchmarks-2026-10.csv. One row per platform and business type, plus each platform's total: accounts, posts, mature posts, median followers, median views per post with the 25th and 75th percentiles, median engagement rate, median posts per week, and a directional flag for groups under 30 accounts.
Edition 1, October 2026: how the sample was drawn (CSV) short-form-benchmarks-sampling-2026-10.csv. One row per platform and business type: accounts drawn from the frame in random order, how many failed screening, how many were ineligible after their posts were read (under 10 posts or inactive for 90 days), and the eligible accounts kept.
Method and full data tables
Method
Sample frame. For each of 12 business types we searched 6 fixed keywords on each platform (TikTok account search; Instagram Reels search, taking each Reel's account). An account found by more than one business type's keywords counts once, under the first type.
Random draw. Accounts that passed a name check were sorted A to Z and shuffled with a fixed seed per business type, then read in that order. No account was picked for doing well or badly.
Screening. An account was dropped if it had more than 1,000,000 followers, read as a creator or media account, or showed no business signal (a business or professional profile, a category, a link, or business wording in the bio). It was then kept only if it had at least 10 posts that were not pinned and had posted in the last 90 days.
Posts. Each account's most recent posts, up to 30, not counting pinned posts. Views and engagement use posts at least 7 days old with at least one view. On Instagram the posts are Reels.
Views a post. The median views across each account's posts, then the median across accounts, so one large account cannot move a group.
Engagement rate. Engagement rate is a post's likes plus comments divided by its views; we take the median across each account's posts that are at least 7 days old, then the median across accounts. TikTok's extended rate adds shares and saves; Instagram does not show those publicly.
Posts a week. Posts in the last 28 days divided by 4, or for accounts that posted all their fetched posts inside 28 days, the rate across those posts. On Instagram this uses the 12 most recent posts of every format from the profile; on TikTok, the posts we read.
Sample sizes. TikTok: 1,332 accounts drawn, 886 failed screening or returned no posts, 115 had under 10 posts or none in 90 days, 331 kept. Instagram Reels: 402 accounts drawn, 19 failed screening or returned no posts, 23 had under 10 posts or none in 90 days, 360 kept. Every group's size is in the tables and the CSV; groups under 30 accounts are marked directional.
Collected 10 to 11 October 2026, through a third-party data API (ScrapeCreators).
The frame comes from platform search, which favours accounts that already do well, and from English keywords, which favour English-language accounts. The draw is random within that frame; it is not a random sample of every business on each platform.
2 of 24 business-type groups have under 30 accounts. Read those rows as directional, not as a benchmark to hold yourself to.
A median is the typical account, not a target. Views on short-form platforms are very uneven: the middle half of accounts spans a wide range in every group.
Instagram figures are Reels only for views and engagement. Instagram does not show shares or saves publicly, so there is no extended engagement rate for Reels.
Screening reads names and bios, so some practitioners who promote their own practice are in, and some businesses with sparse bios are out.
These are one snapshot. Views on recent posts keep growing for a while, which is why posts under 7 days old are left out.
Frequently asked questions
How many views does a small business get on TikTok?
In Postdom's October 2026 sample of 331 small business TikTok accounts, the median post got 1,024 views. Half of the accounts had a typical post between 432 and 3,848 views.
What is a good engagement rate on TikTok and Instagram Reels?
The median small business engagement rate was 3.3% on TikTok and 1.9% on Instagram Reels, counting likes plus comments per view. Above that is better than the typical business in the sample.
How often do small businesses post on TikTok and Instagram?
The median business in the sample posted 1.5 times a week on TikTok and 3.5 times a week on Instagram, counting every format.
How to cite
Postdom. (2026, October 11). Social media benchmarks for small businesses: TikTok and Instagram Reels by business type. https://postdom.com/research/social-media-benchmarks
This page is updated in place as new data arrives, and the link stays the same. Cite the date of the version you used.
Data lead and press contact: Ana Ibáñez Lario, at dean@postdom.com. See the press page for custom cuts and embargoes.
Changelog
: First published: Edition 1, October 2026, a random sample of 691 business accounts collected 10 to 11 October 2026.
3.0% of recent TikTok posts from 300 randomly sampled small business accounts were labelled as AI, and 85 of those 300 accounts had at least one labelled post.
Sample: 20,189 posts from 691 business accounts. Next edition: 22 January 2027, first full edition, target.
Short videos that ended with "let me know below" went with 39% fewer views than the same account's typical video. Directional, with a random-sample re-test due 7 November 2026.
Sample: 374 videos from 136 accounts, within 1,272 videos from 160 accounts. Re-test due: 7 November 2026, on a random sample, the Short-Form Benchmarks sample.